@CipherX 零号 go

Post


CipherX 零号
·
--
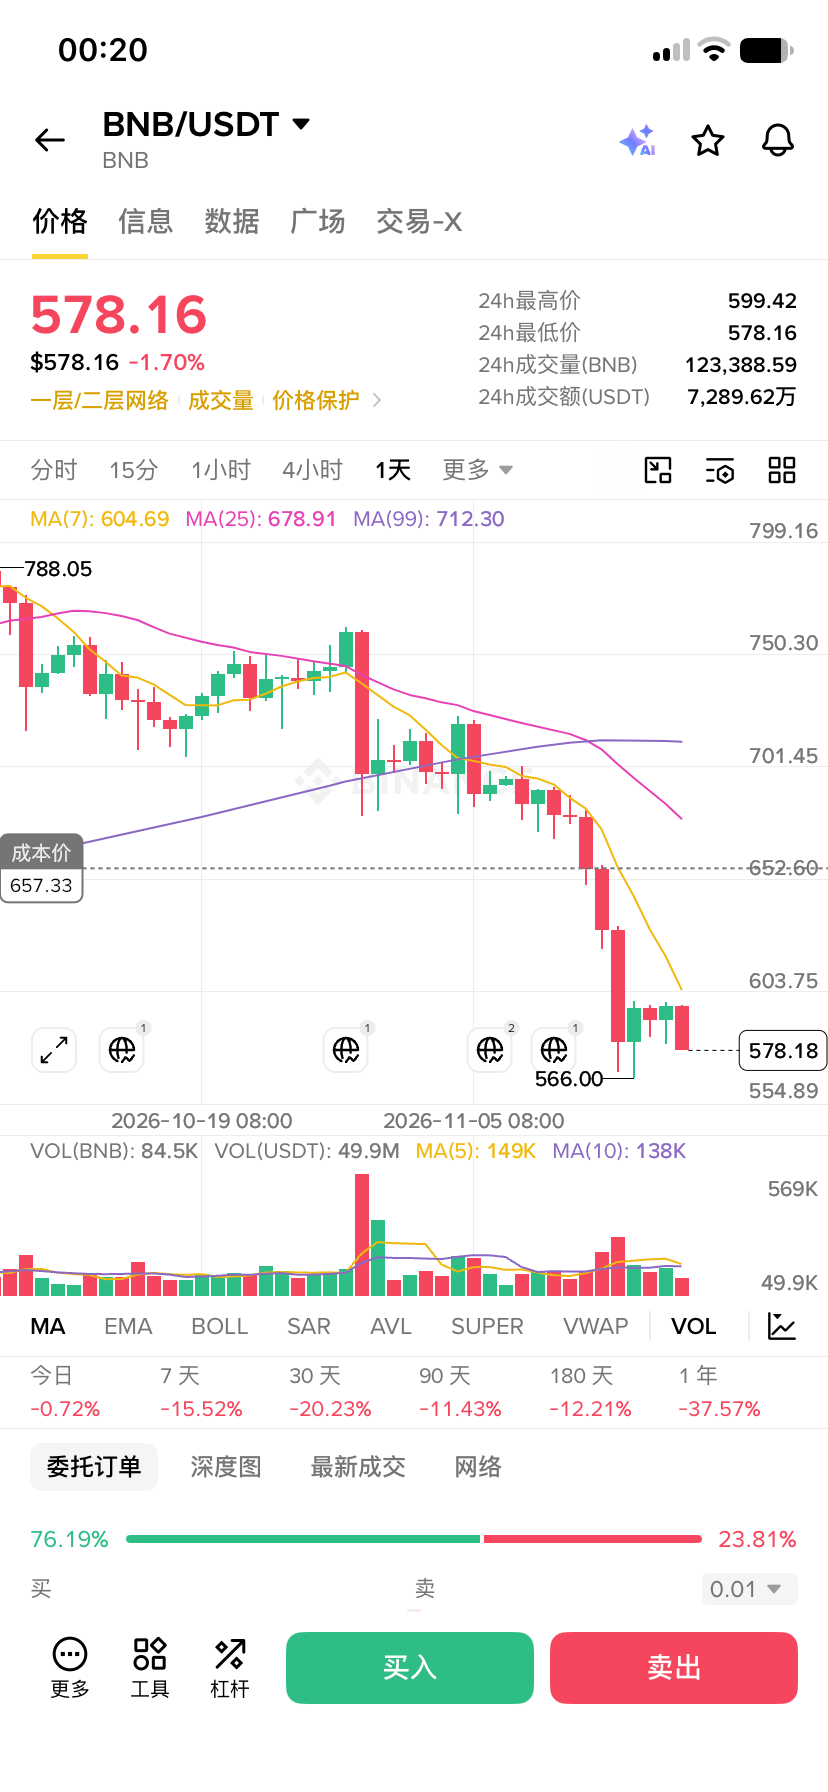
The current BNB/USDT daily chart shows a price of 578.16, down 1.70% over the past 24 hours. Overall, it shows a typical downtrend dominated by bears.
* Moving average resistance: MA(7) is at 604.69, MA(25) at 678.91, and MA(99) at 712.30. The moving averages are bearishly aligned and diverging downward, putting strong pressure on any rebound.
* Support and volatility: The price recently dipped to around 566.00, where it found brief support. It is now consolidating weakly at low levels. The declines over 7 days, 30 days, and 1 year are -15.52%, -20.23%, and -37.57%, respectively.
* Market sentiment: Buy orders account for 76.19% of the order book, compared with 23.18% for sell orders. There is some dip-buying support below, but the broader trend remains weak. Consider staying defensive and avoid blindly buying the dip.
$BNB
$BTC
$ETH
* Moving average resistance: MA(7) is at 604.69, MA(25) at 678.91, and MA(99) at 712.30. The moving averages are bearishly aligned and diverging downward, putting strong pressure on any rebound.
* Support and volatility: The price recently dipped to around 566.00, where it found brief support. It is now consolidating weakly at low levels. The declines over 7 days, 30 days, and 1 year are -15.52%, -20.23%, and -37.57%, respectively.
* Market sentiment: Buy orders account for 76.19% of the order book, compared with 23.18% for sell orders. There is some dip-buying support below, but the broader trend remains weak. Consider staying defensive and avoid blindly buying the dip.
$BNB
$BTC
$ETH