
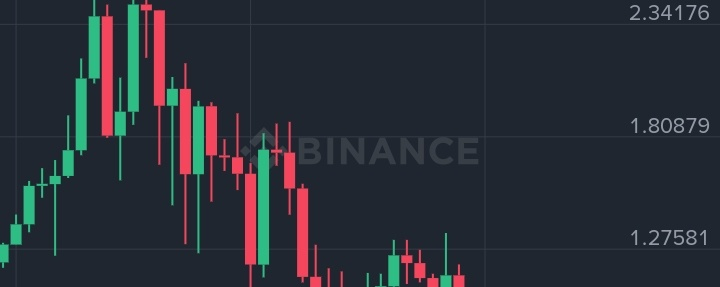

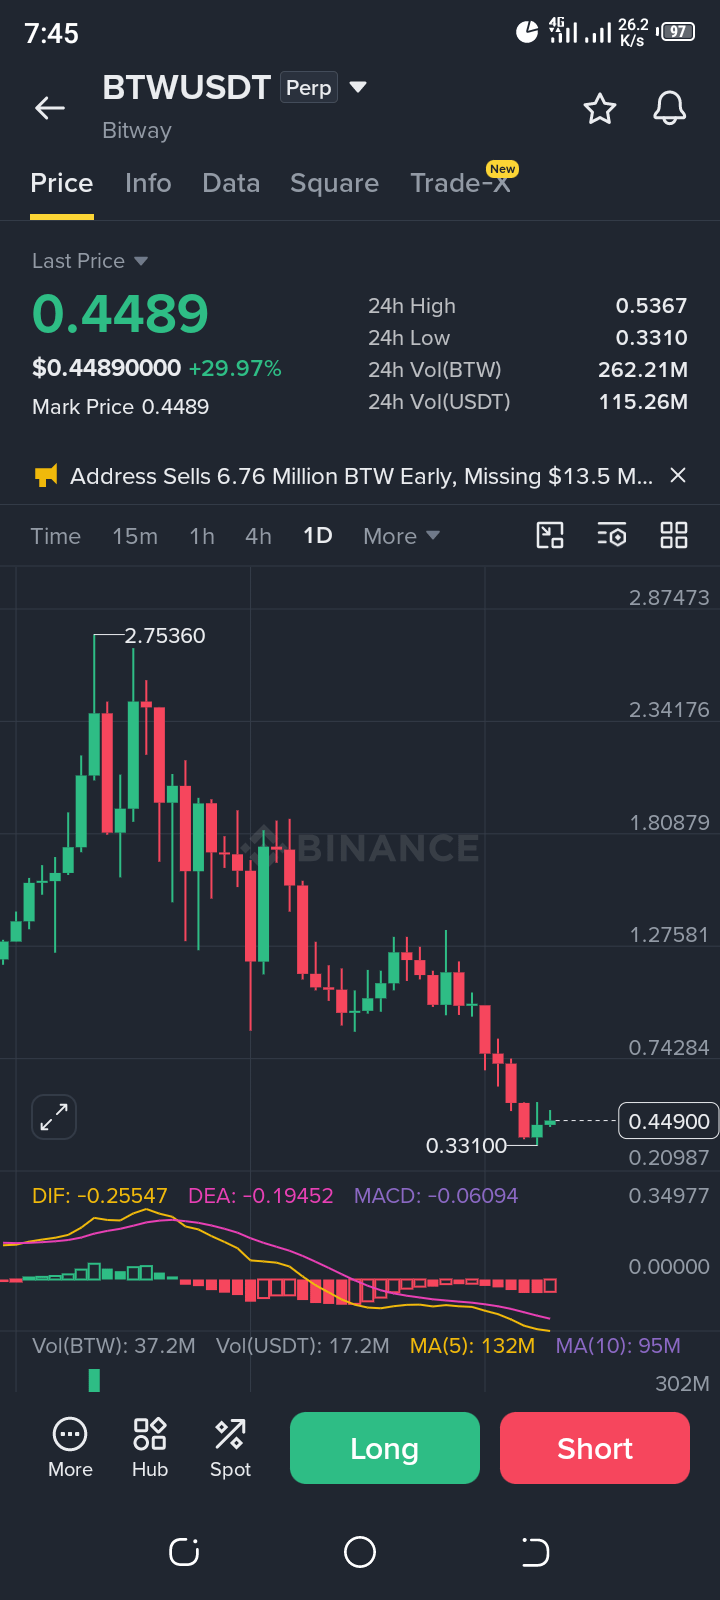
The screenshot displays a 1-day (1D) technical candlestick chart for BTW/USDT on Binance. The last traded price stands at $0.4489, reflecting an intraday gain of +29.97%. Despite this strong daily bounce, the broader chart structure illustrates a heavy, prolonged downtrend after failing to sustain higher levels near its peak of $2.75360.
24-Hour Range & Liquidity
Over the past 24 hours, the asset recorded a low of $0.3310 and a high of $0.5367. Market participation remains active, backed by a 24-hour trading volume of 262.11M BTW and 115.26M USDT. An alert ticker also notes significant on-chain activity, mentioning an address selling 6.76 million BTW early, missing a substantial potential move.
Technical Indicators (MACD & Moving Averages)
MACD: In the lower panel, the MACD indicator shows values of DIF: -0.25547, DEA: -0.19452, and MACD: -0.06094. The histogram bars remain negative, and the MACD lines are trading below the zero baseline, indicating that the macro trend is still bearish despite the recent green recovery candle.
Volume Moving Averages: The volume moving averages show MA(5) at 132M against MA(10) at 95M, indicating a short-term spike in buying volume trying to counter the previous bleeding phase.
Conclusion & Risk Management
While the +29.97% bounce provides a temporary relief rally from the $0.3310 support zone, the overarching technical posture remains cautious due to the steep historical decline from above $2.70. Traders should employ strict risk management, watch out for resistance near the $0.5360 level, and utilize stop-loss orders to protect against sudden trend reversals.@BTW #BTWUSDT $BTW


#NvidiaBoardNotConsideringHuang’sReturnasCEO #AnthropicClearedToListOnNasdaqAsANT #EvernorthRecords$505MImpairmentOnPreListingXRP #GoldmanSachsReports$1.22BInEtherETFHoldings