$JCT
🚨 **When your Fibonacci drawing is accurate on the higher timeframe, you can identify support and resistance levels correctly and know the upcoming targets.
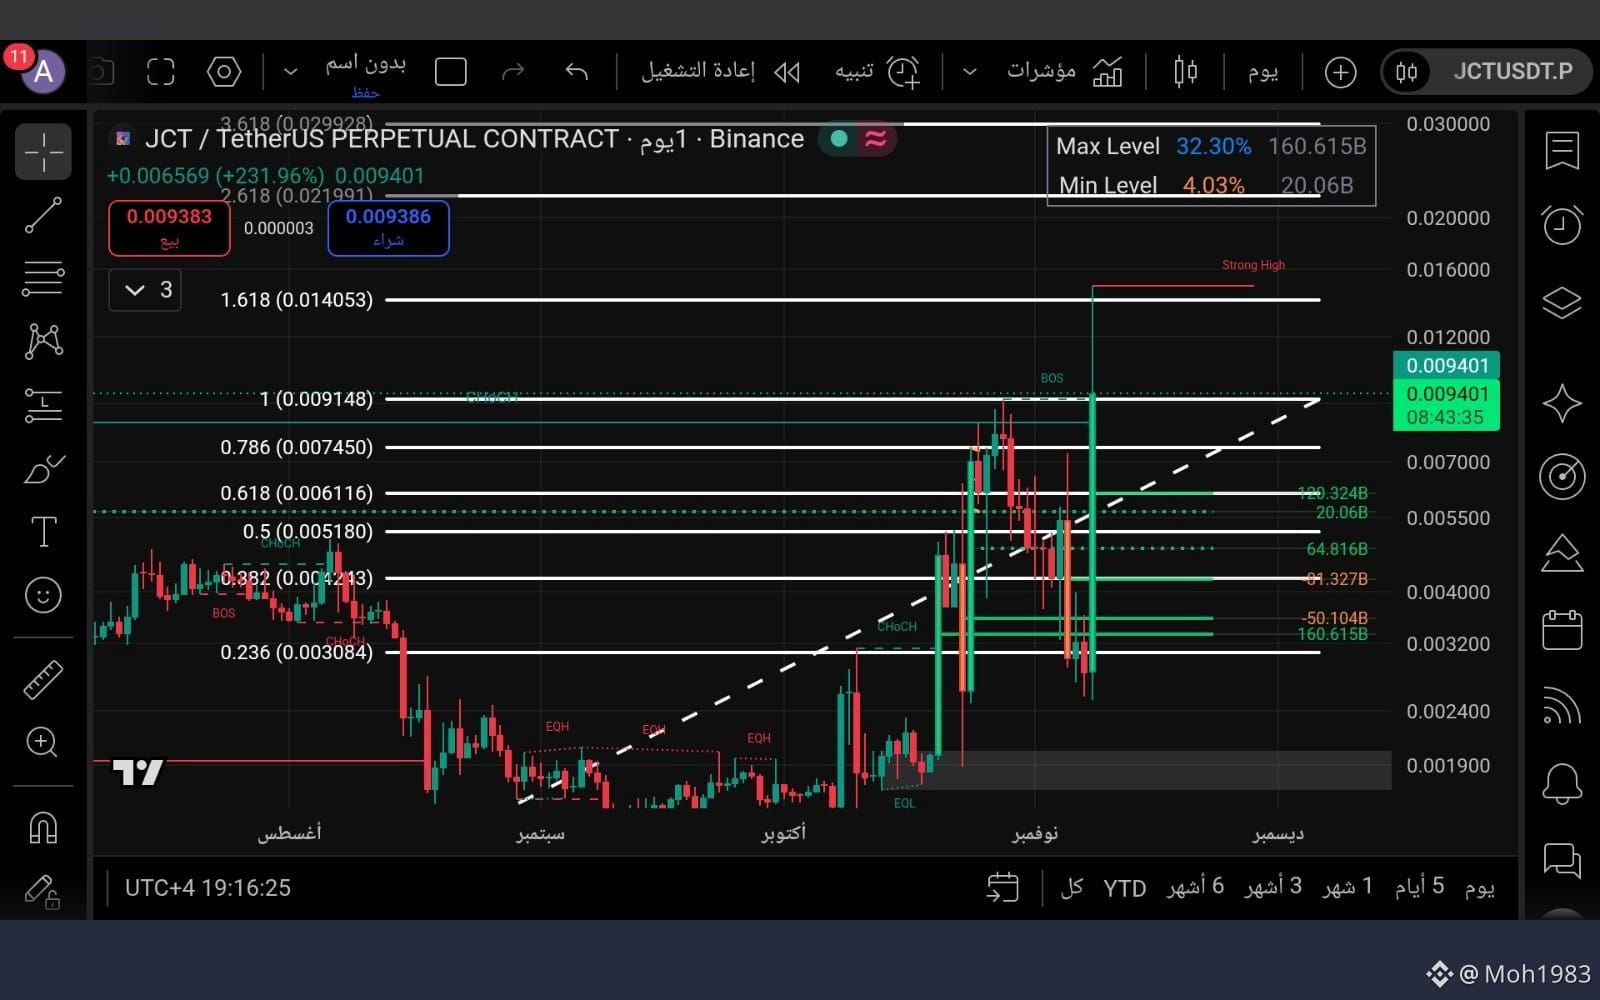
Coin **$JCT** has reached an important area on the daily timeframe after breaking above **0.00914**. Further upside now depends on the price’s ability to hold this level as support.
📈 **Bullish scenario:**
Holding above **0.00914** preserves the chances of continued upside.
📉 **Alternative scenario:**
If support at **0.00914** is lost, we may see a correction toward the next support levels:
- 0.00745
- 0.00611
- 0.00518
The strength of higher-timeframe analysis becomes clear when we can identify support and resistance zones in advance and prepare for more than one scenario.
This analysis is for educational purposes and is not financial advice.
#JCT #Crypto #Technical_Analysis #BinanceSquare
🚨 **When your Fibonacci drawing is accurate on the higher timeframe, you can identify support and resistance levels correctly and know the upcoming targets.
Coin **$JCT** has reached an important area on the daily timeframe after breaking above **0.00914**. Further upside now depends on the price’s ability to hold this level as support.
📈 **Bullish scenario:**
Holding above **0.00914** preserves the chances of continued upside.
📉 **Alternative scenario:**
If support at **0.00914** is lost, we may see a correction toward the next support levels:
- 0.00745
- 0.00611
- 0.00518
The strength of higher-timeframe analysis becomes clear when we can identify support and resistance zones in advance and prepare for more than one scenario.
This analysis is for educational purposes and is not financial advice.
#JCT #Crypto #Technical_Analysis #BinanceSquare