📊 XRP Historical Seasonality Matrix (2017–2026):
What can 10 years of monthly data teach us?
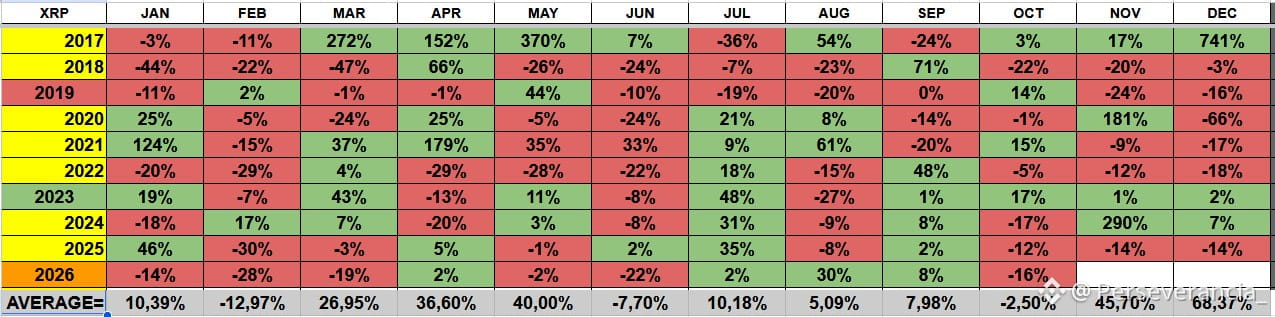
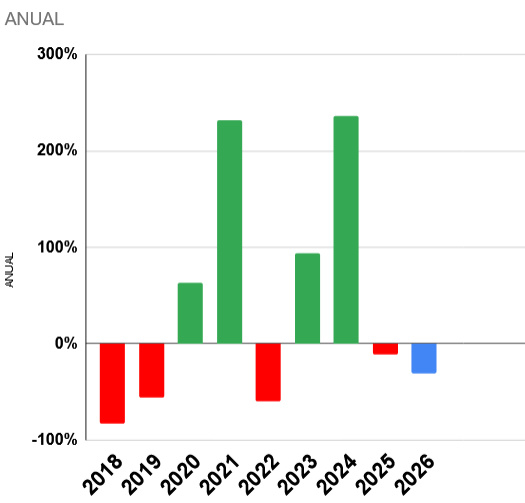
I’m sharing this heatmap of monthly returns for $XRP , which I put together to analyze historical behavior patterns and cycles.
A few key observations from looking at the decade:
1️⃣ Q4 behavior (Oct–Nov–Dec): Historically, the year’s final quarter has seen some of the asset’s most volatile moves and strongest bullish momentum (as in 2017, 2020, and 2024).
2️⃣ Consolidation summers: The months of May through August tend to show corrective or sideways trading ranges (with some institutional exceptions).
3️⃣ Maturation phase: As institutional liquidity enters the ecosystem and regulatory clarity advances, the extreme percentages of the past are beginning to stabilize within more defined accumulation ranges.
📌 Analyzing the past doesn’t guarantee the future, but it gives us a roadmap so we don’t trade blindly or get swept up in day-to-day emotions.
What can 10 years of monthly data teach us?
I’m sharing this heatmap of monthly returns for $XRP , which I put together to analyze historical behavior patterns and cycles.
A few key observations from looking at the decade:
1️⃣ Q4 behavior (Oct–Nov–Dec): Historically, the year’s final quarter has seen some of the asset’s most volatile moves and strongest bullish momentum (as in 2017, 2020, and 2024).
2️⃣ Consolidation summers: The months of May through August tend to show corrective or sideways trading ranges (with some institutional exceptions).
3️⃣ Maturation phase: As institutional liquidity enters the ecosystem and regulatory clarity advances, the extreme percentages of the past are beginning to stabilize within more defined accumulation ranges.
📌 Analyzing the past doesn’t guarantee the future, but it gives us a roadmap so we don’t trade blindly or get swept up in day-to-day emotions.