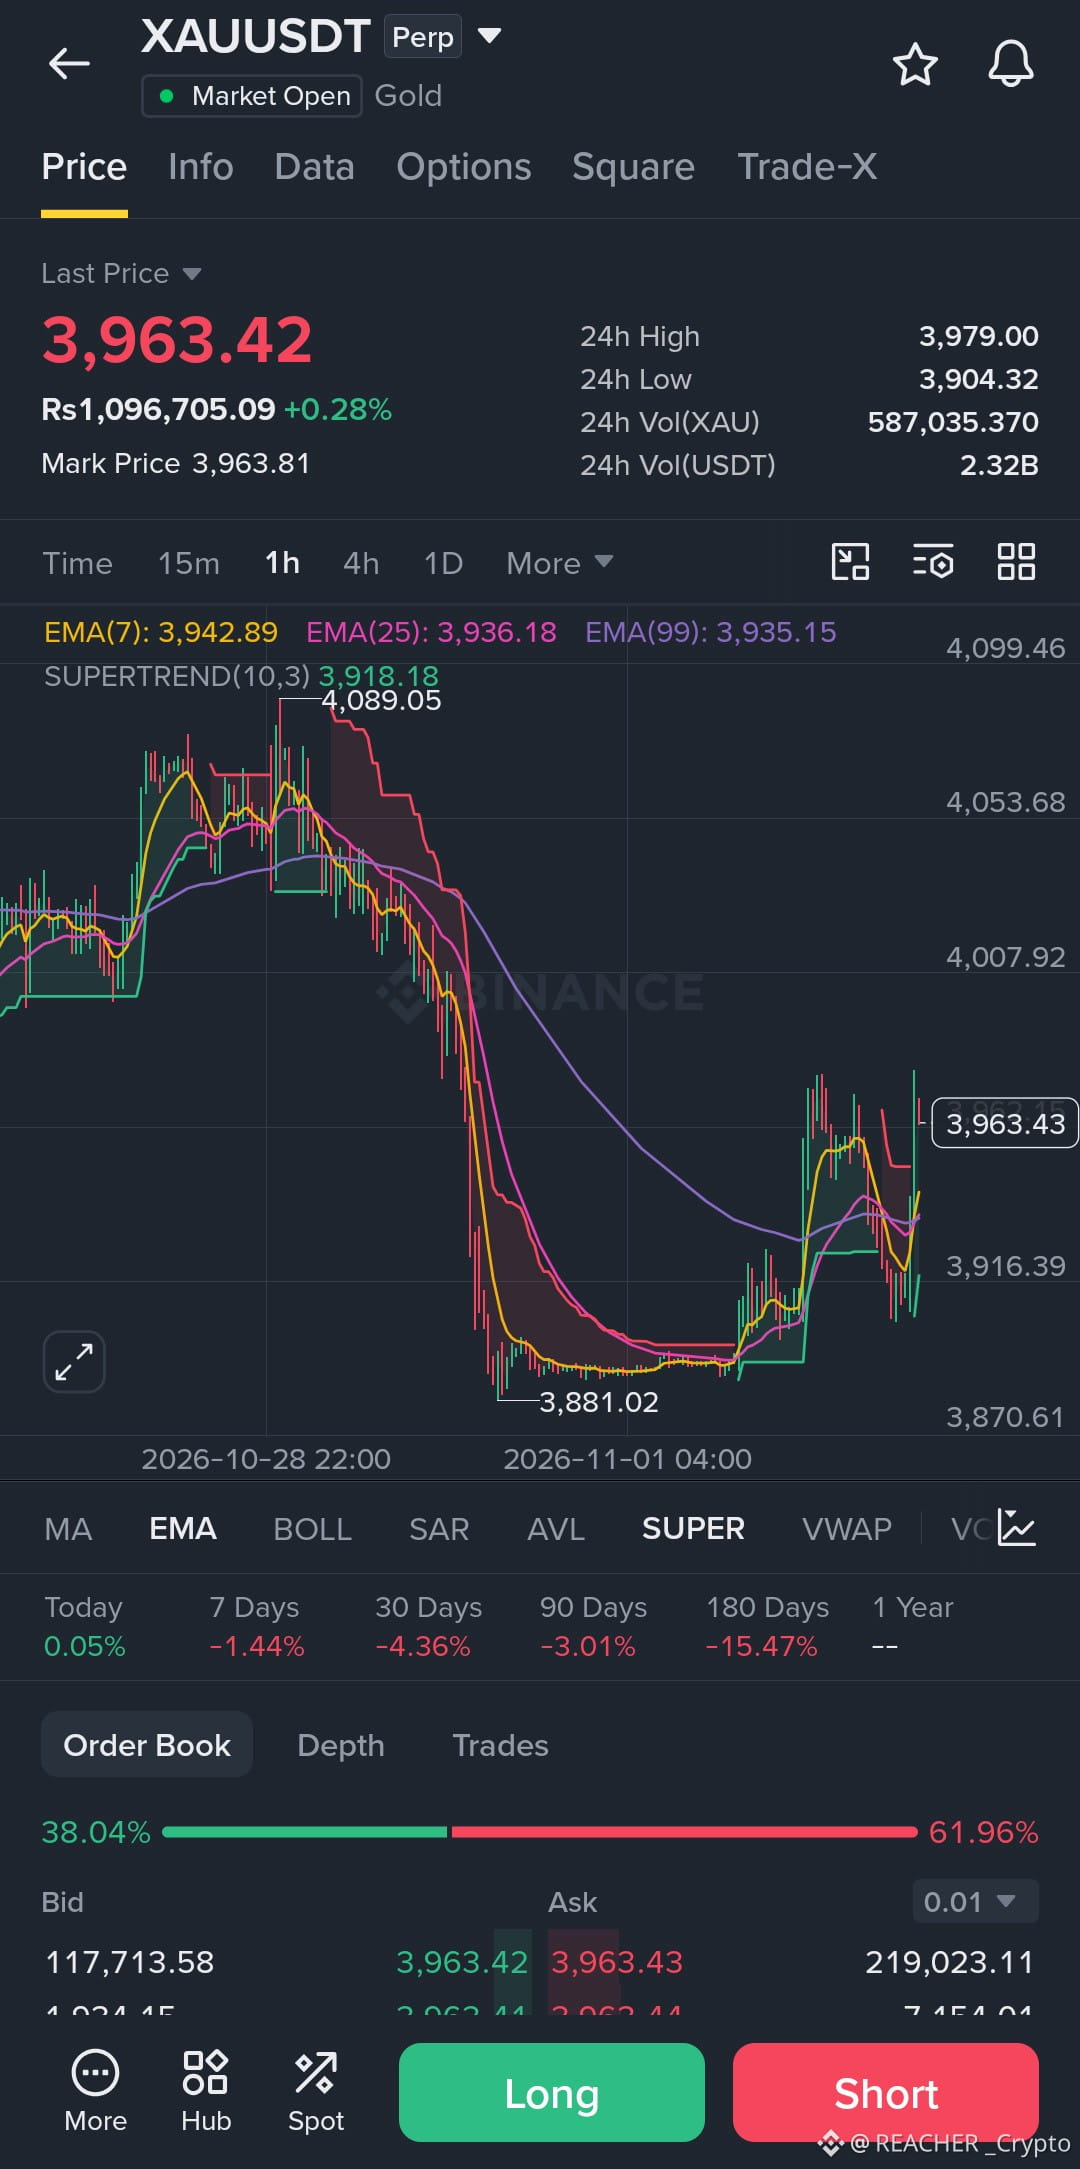
I almost ignored this XAU chart until I noticed how the price was interacting with the EMAs and the Supertrend indicator on the right side.
Looking at the 1-hour timeframe, the macro trend was heavily bearish, dropping from the 4,089 peak down to the 3,881 low. But zoom in on the recent price action. We’ve seen a sharp bounce, and price is currently sitting at 3,963.42.
Here is the critical detail: the price has reclaimed the EMA cluster. The EMA7 (3,942), EMA25 (3,936), and EMA99 (3,935) are all acting as dynamic support beneath us. More importantly, the Supertrend indicator has flipped to green, with the support line now sitting at 3,918.
However, look at the order book. It’s showing 61.96% sell pressure against only 38.04% buy pressure. This tells me that while the momentum has shifted locally, there is heavy overhead resistance.
A lesson I've learned from trading these bounces is that you don't buy the first green candle; you wait for the market to prove it can hold the moving averages.
Trade Plan:
Bias: Short-term bullish (Playing the oversold bounce).
Entry Zone: 3,940.00 – 3,950.00 (Looking for a slight pullback to retest the EMA cluster and Supertrend).
Stop Loss: 3,880.00 (Just below the recent capitulation wick).
Target 1: 3,979.00 (24h high and immediate resistance).
Target 2: 4,007.92 (Mid-range macro resistance).
Target 3: 4,053.68 (Previous breakdown level).
Risk/Reward: 1:2.5
Invalidation: A 1H candle close back below 3,910.00, signaling the bears are still in control.
Don't FOMO into a falling candle. Wait for the hourly candle to close strong, respect your stop loss, and never risk more than you can afford to lose.
Do you think XAU has finally found a bottom here, or is this just a lower high before the next dump?
$XAU
#AppleReportsMixedResults #USMidtermElections #Nasdaq100EntersCorrection #USOctoberNFP-AreRateCutsStillPossible
Looking at the 1-hour timeframe, the macro trend was heavily bearish, dropping from the 4,089 peak down to the 3,881 low. But zoom in on the recent price action. We’ve seen a sharp bounce, and price is currently sitting at 3,963.42.
Here is the critical detail: the price has reclaimed the EMA cluster. The EMA7 (3,942), EMA25 (3,936), and EMA99 (3,935) are all acting as dynamic support beneath us. More importantly, the Supertrend indicator has flipped to green, with the support line now sitting at 3,918.
However, look at the order book. It’s showing 61.96% sell pressure against only 38.04% buy pressure. This tells me that while the momentum has shifted locally, there is heavy overhead resistance.
A lesson I've learned from trading these bounces is that you don't buy the first green candle; you wait for the market to prove it can hold the moving averages.
Trade Plan:
Bias: Short-term bullish (Playing the oversold bounce).
Entry Zone: 3,940.00 – 3,950.00 (Looking for a slight pullback to retest the EMA cluster and Supertrend).
Stop Loss: 3,880.00 (Just below the recent capitulation wick).
Target 1: 3,979.00 (24h high and immediate resistance).
Target 2: 4,007.92 (Mid-range macro resistance).
Target 3: 4,053.68 (Previous breakdown level).
Risk/Reward: 1:2.5
Invalidation: A 1H candle close back below 3,910.00, signaling the bears are still in control.
Don't FOMO into a falling candle. Wait for the hourly candle to close strong, respect your stop loss, and never risk more than you can afford to lose.
Do you think XAU has finally found a bottom here, or is this just a lower high before the next dump?
$XAU
#AppleReportsMixedResults #USMidtermElections #Nasdaq100EntersCorrection #USOctoberNFP-AreRateCutsStillPossible