

蝉虹
39 Posts

蝉虹
Report
Block User
既然终点是月球,那么在珠穆朗玛峰上车和在马里亚纳海沟上车,其实没有什么区别。
Open Trade
2 Years
46 Following
2 Followers
4 Liked
Posts
Portfolio
·
--
$BTC Long/Short Outlook + Liquidation Map + Trade Entry Suggestions + Technical Analysis (2026.10.30 18:35)
Technical Analysis: On Friday morning, BTC traded sideways around $77.4–78K and has broken below the key $80K support. Resistance above is $80–80.5K, with support below at $76–77K. The short-term RSI is weak, bearish momentum on the MACD remains, and trading volume is confirming the decline. The Fibonacci retracement is in the 0.382–0.5 range, with $76K and $75K as levels to watch below. If the price holds in the short term and rebounds, it could move back toward $80K; if it loses the $76–77K level, downside risk increases toward $75–72K. Watch whether support holds.
Long/Short Outlook: Bulls: Some are buying the dip around key support levels, looking for a rebound to ease pressure. Bears/Cautious traders: Most remain wary of further declines after the break below $80K and are waiting for a strong signal before entering.
Liquidation Map Highlights: Dense short liquidation zone above: over $80,000 and higher. Long liquidation zone below: around $76,000–$78,000, with further liquidity around $75,000.
Long/Short Trade Entry Suggestions:
Long: Entry at $76,500–$77,500 (scale in on a retest) or after holding above $78,500. Stop-loss below $75,800. Targets: TP1 $80,000; TP2 $82,000–$84,000.
Short (at highs/on a rebound): Entry at $79,500–$80,500. Stop-loss if price holds above $81,500. Targets: TP1 $77,000; TP2 $74,500–$72,000.
Trading Framework: The main approach is to wait for support confirmation or a quick reclaim of $80K before entering. Risk 1–2% per trade, leverage ≤5x. Use strict stop-losses and watch the key $76–77K and $80K levels.
(For reference only; not investment advice)$BTC
{future}(BTCUSDT)
$BTC Long/Short Outlook + Liquidation Map + Trade Entry Suggestions + Technical Analysis (2026.10.30 18:35)
Technical Analysis: On Friday morning, BTC traded sideways around $77.4–78K and has broken below the key $80K support. Resistance above is $80–80.5K, with support below at $76–77K. The short-term RSI is weak, bearish momentum on the MACD remains, and trading volume is confirming the decline. The Fibonacci retracement is in the 0.382–0.5 range, with $76K and $75K as levels to watch below. If the price holds in the short term and rebounds, it could move back toward $80K; if it loses the $76–77K level, downside risk increases toward $75–72K. Watch whether support holds.
Long/Short Outlook: Bulls: Some are buying the dip around key support levels, looking for a rebound to ease pressure. Bears/Cautious traders: Most remain wary of further declines after the break below $80K and are waiting for a strong signal before entering.
Liquidation Map Highlights: Dense short liquidation zone above: over $80,000 and higher. Long liquidation zone below: around $76,000–$78,000, with further liquidity around $75,000.
Long/Short Trade Entry Suggestions:
Long: Entry at $76,500–$77,500 (scale in on a retest) or after holding above $78,500. Stop-loss below $75,800. Targets: TP1 $80,000; TP2 $82,000–$84,000.
Short (at highs/on a rebound): Entry at $79,500–$80,500. Stop-loss if price holds above $81,500. Targets: TP1 $77,000; TP2 $74,500–$72,000.
Trading Framework: The main approach is to wait for support confirmation or a quick reclaim of $80K before entering. Risk 1–2% per trade, leverage ≤5x. Use strict stop-losses and watch the key $76–77K and $80K levels.
(For reference only; not investment advice)$BTC
63
·
--
$BTC Bullish/Bearish Views + Liquidation Map + Trade Entry Suggestions + Technical Analysis (2026.10.30 9:20)
Technical Analysis: On Thursday night, BTC broke below the key $80K support and fell back to around $77–78.5K. Resistance is at $80–80.5K, with support at $76–77K. The short-term RSI is weak, bearish MACD momentum is strengthening, and trading volume is confirming the decline. FVG support has been broken. A quick reclaim of $80K in the short term could be considered a false breakdown; if $76–77K continues to fail, the risk increases, with $74–72K in sight. Watch the strength of buying support below.
Bullish/Bearish Views: Bulls: Some are buying the dips at lower levels, looking to long-term support and a rebound. Bears/Cautious: Most say the failure to hold $80K is unfavorable, with sellers in control; they are waiting for signs of strength before entering.
Key Liquidation Map Levels: Dense short liquidation zone above: above $80,000 and higher. Long liquidation zone below: around $76,000–$78,000.
Long/Short Trade Suggestions:
Long: Entry at $75,500–$76,500 (scale in on a retest) or after holding above $78,500. Stop-loss: below $75,000. Targets: TP1 $80,000; TP2 $82,000–$84,000.
Short (at highs/on a rebound): Entry at $79,500–$80,500. Stop-loss: after holding above $81,500. Targets: TP1 $77,000; TP2 $74,500–$72,000.
Trading Framework: The main approach is to wait for support to be confirmed or for a quick reclaim of $80K before entering. Risk 1–2% per trade; leverage ≤5x. Use strict stop-losses and watch the key $76–77K and $80K levels.
(For reference only; not investment advice.)
{future}(BTCUSDT)
$BTC Bullish/Bearish Views + Liquidation Map + Trade Entry Suggestions + Technical Analysis (2026.10.30 9:20)
Technical Analysis: On Thursday night, BTC broke below the key $80K support and fell back to around $77–78.5K. Resistance is at $80–80.5K, with support at $76–77K. The short-term RSI is weak, bearish MACD momentum is strengthening, and trading volume is confirming the decline. FVG support has been broken. A quick reclaim of $80K in the short term could be considered a false breakdown; if $76–77K continues to fail, the risk increases, with $74–72K in sight. Watch the strength of buying support below.
Bullish/Bearish Views: Bulls: Some are buying the dips at lower levels, looking to long-term support and a rebound. Bears/Cautious: Most say the failure to hold $80K is unfavorable, with sellers in control; they are waiting for signs of strength before entering.
Key Liquidation Map Levels: Dense short liquidation zone above: above $80,000 and higher. Long liquidation zone below: around $76,000–$78,000.
Long/Short Trade Suggestions:
Long: Entry at $75,500–$76,500 (scale in on a retest) or after holding above $78,500. Stop-loss: below $75,000. Targets: TP1 $80,000; TP2 $82,000–$84,000.
Short (at highs/on a rebound): Entry at $79,500–$80,500. Stop-loss: after holding above $81,500. Targets: TP1 $77,000; TP2 $74,500–$72,000.
Trading Framework: The main approach is to wait for support to be confirmed or for a quick reclaim of $80K before entering. Risk 1–2% per trade; leverage ≤5x. Use strict stop-losses and watch the key $76–77K and $80K levels.
(For reference only; not investment advice.)
378
·
--
$BTC Long and short perspectives + liquidation map + entry suggestions + technical analysis (2026.10.29 22:00)
Technical analysis: On Thursday morning, BTC held a range near $80–80.1K. Upper resistance is $81.5–82K, and lower support is $79.5–80K. Short-term RSI is neutral to slightly weak, MACD momentum is weak, and volume is average. The FVG near $80K was tested. In the short term, if it holds and rebounds, a move back to $81.5–82K is possible; if it loses $79.5–80K, downside risk increases to $78–76K. Attention should be paid to support validity and liquidation sweeps.
Long and short perspectives: Bulls: believe the $80K support remains valid, there is more short-side liquidity above, and the long-term bullish thesis has not changed. Bears/Cautious: focus on the $79K long liquidation zone, which may be swept; short-term volatility is limited, so the stance is cautious.
Key points of the liquidation map: Dense short liquidation zones above: near $82,000, $85,000, and $87,000. Long liquidation zone below: near $79,000 (about $2.5 billion)
Long and short entry suggestions:
Long: Entry $78,800–$79,800 (buy in batches on a retest) or hold above $80,500 Stop loss below $79,200 Targets TP1 $81,500 TP2 $83,000–$85,000
Short (high level/rebound): Entry $81,200–$81,800 Stop loss above $82,500 Targets TP1 $80,000 TP2 $78,500–$76,500
Trading framework: The main idea is to wait for support confirmation or a breakout before entering. Risk per trade 1–2%, leverage ≤5x. Use strict stop losses and watch the key levels of $80K and $79.5K.
(The above is for reference only, not investment advice)$BTC
{future}(BTCUSDT)
$BTC Long and short perspectives + liquidation map + entry suggestions + technical analysis (2026.10.29 22:00)
Technical analysis: On Thursday morning, BTC held a range near $80–80.1K. Upper resistance is $81.5–82K, and lower support is $79.5–80K. Short-term RSI is neutral to slightly weak, MACD momentum is weak, and volume is average. The FVG near $80K was tested. In the short term, if it holds and rebounds, a move back to $81.5–82K is possible; if it loses $79.5–80K, downside risk increases to $78–76K. Attention should be paid to support validity and liquidation sweeps.
Long and short perspectives: Bulls: believe the $80K support remains valid, there is more short-side liquidity above, and the long-term bullish thesis has not changed. Bears/Cautious: focus on the $79K long liquidation zone, which may be swept; short-term volatility is limited, so the stance is cautious.
Key points of the liquidation map: Dense short liquidation zones above: near $82,000, $85,000, and $87,000. Long liquidation zone below: near $79,000 (about $2.5 billion)
Long and short entry suggestions:
Long: Entry $78,800–$79,800 (buy in batches on a retest) or hold above $80,500 Stop loss below $79,200 Targets TP1 $81,500 TP2 $83,000–$85,000
Short (high level/rebound): Entry $81,200–$81,800 Stop loss above $82,500 Targets TP1 $80,000 TP2 $78,500–$76,500
Trading framework: The main idea is to wait for support confirmation or a breakout before entering. Risk per trade 1–2%, leverage ≤5x. Use strict stop losses and watch the key levels of $80K and $79.5K.
(The above is for reference only, not investment advice)$BTC
131
·
--
$BTC Bull/Bear Views + Liquidation Map + Trade Setup Suggestions + Technical Analysis (2026.10.29 11:30)
Technical analysis: On Wednesday evening, BTC pulled back to around $80–80.1K. After the Fed held rates steady, the price initially rebounded before moving lower. Resistance is at $81.5–82K, with support at $79.5–80K. The short-term RSI has retreated to neutral-to-weak territory, MACD momentum has weakened, and trading volume has declined along with the price. The FVG around $80K has been tested. If support holds and the price rebounds, it could move back toward $81.5K in the short term. If $79.5–80K gives way, the risk of a further decline to $78–76K increases. Watch whether support holds.
Bull/bear views: Bulls: Believe the $80K support remains intact and the long-term bullish thesis is unchanged; some are building positions on dips. Bears/cautious traders: The price has pulled back under pressure, and some have taken profits on shorts opened at higher levels; they are watching for the possibility of a further decline.
Key liquidation map levels: Dense short liquidation zone above: around $81,500–$82,800. Long liquidation zone below: around $79,000–$80,000.
Bull/bear trade setup suggestions:
Long: Entry: scale in on a pullback to $78,800–$79,600, or after the price holds above $80,500. Stop-loss: below $79,200. Targets: TP1 $81,500; TP2 $83,000–$85,000.
Short (at higher levels/on a rebound): Entry: $81,200–$81,800. Stop-loss: once the price holds above $82,500. Targets: TP1 $80,000; TP2 $78,500–$76,500.
Trading framework: The main approach is to wait for support to be confirmed or for a breakout before entering. Risk 1–2% per trade; leverage ≤5x. Use strict stop-losses and watch the key levels at $80K and $79.5K.
(For reference only; not investment advice)$BTC
{future}(BTCUSDT)
$BTC Bull/Bear Views + Liquidation Map + Trade Setup Suggestions + Technical Analysis (2026.10.29 11:30)
Technical analysis: On Wednesday evening, BTC pulled back to around $80–80.1K. After the Fed held rates steady, the price initially rebounded before moving lower. Resistance is at $81.5–82K, with support at $79.5–80K. The short-term RSI has retreated to neutral-to-weak territory, MACD momentum has weakened, and trading volume has declined along with the price. The FVG around $80K has been tested. If support holds and the price rebounds, it could move back toward $81.5K in the short term. If $79.5–80K gives way, the risk of a further decline to $78–76K increases. Watch whether support holds.
Bull/bear views: Bulls: Believe the $80K support remains intact and the long-term bullish thesis is unchanged; some are building positions on dips. Bears/cautious traders: The price has pulled back under pressure, and some have taken profits on shorts opened at higher levels; they are watching for the possibility of a further decline.
Key liquidation map levels: Dense short liquidation zone above: around $81,500–$82,800. Long liquidation zone below: around $79,000–$80,000.
Bull/bear trade setup suggestions:
Long: Entry: scale in on a pullback to $78,800–$79,600, or after the price holds above $80,500. Stop-loss: below $79,200. Targets: TP1 $81,500; TP2 $83,000–$85,000.
Short (at higher levels/on a rebound): Entry: $81,200–$81,800. Stop-loss: once the price holds above $82,500. Targets: TP1 $80,000; TP2 $78,500–$76,500.
Trading framework: The main approach is to wait for support to be confirmed or for a breakout before entering. Risk 1–2% per trade; leverage ≤5x. Use strict stop-losses and watch the key levels at $80K and $79.5K.
(For reference only; not investment advice)$BTC
117
·
--
$BTC Long/Short Outlook + Liquidation Map + Trade Recommendations + Technical Analysis (2026.10.28 20:30)
Technical Analysis: On Wednesday morning, BTC recovered to $81.2–81.4K, reclaimed the range low, and retested support. Resistance is at $81.7–82.8K, with support at $80.5–81K. The short-term RSI has recovered to neutral-to-bullish levels, MACD momentum has improved, but volume remains limited. The FVG has been mostly filled. Today's Fed decision is a key catalyst. If BTC holds above and breaks through $81.7–82K, a rebound is possible; if it falls back below $80.5K, downside risk increases toward $78–76K. Wait for macroeconomic confirmation.
Long/Short Outlook: Bulls: Believe the retest of range support has held, that the market was previously too pessimistic, and that BTC has rebounded after FOMC meetings in the past. Bears/Cautious traders: The market remains in a key range; some are holding short positions or waiting for direction after the Fed decision, with event risk in focus.
Liquidation Map Highlights: Dense short liquidation zone above: around $81,700–$82,800. Long liquidation zone below: $80,000 and lower.
Long/Short Trade Recommendations:
Long: Entry at $79,500–$80,500 (scale in on a pullback) or on a breakout above $81,700. Stop-loss below $80,200. Targets: TP1 $83,000; TP2 $85,000–$87,000.
Short (at highs/on a rebound): Entry at $82,000–$82,800. Stop-loss if price holds above $83,500. Targets: TP1 $81,000; TP2 $79,500–$78,000.
Trading Framework: The main approach is to wait for breakout confirmation or a clear direction after the Fed decision before entering. Risk 1–2% per trade; leverage ≤5x. Use strict stop-losses and watch the key levels at $81.7K and $80.5K.
(For reference only; not investment advice)$BTC
{future}(BTCUSDT)
$BTC Long/Short Outlook + Liquidation Map + Trade Recommendations + Technical Analysis (2026.10.28 20:30)
Technical Analysis: On Wednesday morning, BTC recovered to $81.2–81.4K, reclaimed the range low, and retested support. Resistance is at $81.7–82.8K, with support at $80.5–81K. The short-term RSI has recovered to neutral-to-bullish levels, MACD momentum has improved, but volume remains limited. The FVG has been mostly filled. Today's Fed decision is a key catalyst. If BTC holds above and breaks through $81.7–82K, a rebound is possible; if it falls back below $80.5K, downside risk increases toward $78–76K. Wait for macroeconomic confirmation.
Long/Short Outlook: Bulls: Believe the retest of range support has held, that the market was previously too pessimistic, and that BTC has rebounded after FOMC meetings in the past. Bears/Cautious traders: The market remains in a key range; some are holding short positions or waiting for direction after the Fed decision, with event risk in focus.
Liquidation Map Highlights: Dense short liquidation zone above: around $81,700–$82,800. Long liquidation zone below: $80,000 and lower.
Long/Short Trade Recommendations:
Long: Entry at $79,500–$80,500 (scale in on a pullback) or on a breakout above $81,700. Stop-loss below $80,200. Targets: TP1 $83,000; TP2 $85,000–$87,000.
Short (at highs/on a rebound): Entry at $82,000–$82,800. Stop-loss if price holds above $83,500. Targets: TP1 $81,000; TP2 $79,500–$78,000.
Trading Framework: The main approach is to wait for breakout confirmation or a clear direction after the Fed decision before entering. Risk 1–2% per trade; leverage ≤5x. Use strict stop-losses and watch the key levels at $81.7K and $80.5K.
(For reference only; not investment advice)$BTC
243
·
--
$BTC Bullish/Bearish Outlook + Liquidation Map + Trade Setup Suggestions + Technical Analysis (2026.10.28 14:50)
Technical Analysis: Early Wednesday, BTC remained range-bound between $80.7–80.9K, having been stuck around $79.1–81.3K for about six days. Resistance is at $81.3K, with support at $80–80.5K. The short-term RSI is neutral, and MACD momentum is neutral. The FVG has been mostly filled. Today’s Fed decision is a key catalyst. In the short term, holding above and breaking through $81.3K could signal a rebound; losing $80K would increase the risk of a move down to $78–76K. Wait for macroeconomic confirmation of direction.
Bullish/Bearish Outlook: Bulls: Believe $80K support is holding and short liquidations could fuel a rebound; outlook is constructive. Bears/Cautious: Price remains range-bound; some are increasing short positions and waiting for direction after the Fed decision, with a cautious short-term outlook.
Key Liquidation Map Levels: Dense short liquidation zone above: around $81,300 and higher. Long liquidation zone below: around $79,100–$78,000.
Bullish/Bearish Trade Setup Suggestions:
Long: Entry at $79,500–$80,400 (scale in on a retest) or on a break above $81,300. Stop-loss below $79,000. Targets: TP1 $82,500; TP2 $84,000–$85,000.
Short (at highs/on a rebound): Entry at $81,400–$82,000. Stop-loss if price holds above $82,500. Targets: TP1 $80,000; TP2 $78,500–$76,500.
Trading Framework: The main approach is to wait for a range breakout or clearer direction after the Fed decision before entering. Risk 1–2% per trade, with leverage ≤5x. Use strict stop-losses and watch the key levels at $81.3K and $80K.
(For reference only; not investment advice.)
{future}(BTCUSDT)
$BTC Bullish/Bearish Outlook + Liquidation Map + Trade Setup Suggestions + Technical Analysis (2026.10.28 14:50)
Technical Analysis: Early Wednesday, BTC remained range-bound between $80.7–80.9K, having been stuck around $79.1–81.3K for about six days. Resistance is at $81.3K, with support at $80–80.5K. The short-term RSI is neutral, and MACD momentum is neutral. The FVG has been mostly filled. Today’s Fed decision is a key catalyst. In the short term, holding above and breaking through $81.3K could signal a rebound; losing $80K would increase the risk of a move down to $78–76K. Wait for macroeconomic confirmation of direction.
Bullish/Bearish Outlook: Bulls: Believe $80K support is holding and short liquidations could fuel a rebound; outlook is constructive. Bears/Cautious: Price remains range-bound; some are increasing short positions and waiting for direction after the Fed decision, with a cautious short-term outlook.
Key Liquidation Map Levels: Dense short liquidation zone above: around $81,300 and higher. Long liquidation zone below: around $79,100–$78,000.
Bullish/Bearish Trade Setup Suggestions:
Long: Entry at $79,500–$80,400 (scale in on a retest) or on a break above $81,300. Stop-loss below $79,000. Targets: TP1 $82,500; TP2 $84,000–$85,000.
Short (at highs/on a rebound): Entry at $81,400–$82,000. Stop-loss if price holds above $82,500. Targets: TP1 $80,000; TP2 $78,500–$76,500.
Trading Framework: The main approach is to wait for a range breakout or clearer direction after the Fed decision before entering. Risk 1–2% per trade, with leverage ≤5x. Use strict stop-losses and watch the key levels at $81.3K and $80K.
(For reference only; not investment advice.)
71
·
--
$BTC Long/Short Views + Liquidation Map + Trade Setup Suggestions + Technical Analysis (2026.10.27 13:10)
Technical Analysis: Early Tuesday, BTC continued to trade below $80K after dipping below that level over the weekend and recovering. The daily range remains $79.5–87K. Resistance is at $81–82K, with support at $79.5–80K. ETF flows turned positive on Monday, at around $110 million; weekly flows had previously remained net positive. The weekly Stochastic RSI has formed a bearish crossover, while the short-term RSI is neutral to weak. The FVG has been partially mitigated. If BTC can hold above $80.5K in the short term, a rebound is possible; a renewed break below $79.5K would increase the risk of a drop to $78–76.5K. Confirmation that support is holding is needed.
Long/Short Views: Bulls: See $79.5–80K as a reasonable accumulation zone. Short-term holder profitability has fallen to 70%, offering a better entry window; some are still holding long positions. Bears/Cautious View: Consecutive weekly closes lower and a drop back into the range point to a bearish short-term outlook. If support breaks, BTC could fall toward $76K.
Key Liquidation Map Levels: Dense short liquidation zone above: around $81,300 and $84,000–$87,000. Long liquidation zone below: around $78,800; the $79,500–$80,000 zone has already seen substantial liquidations.
Long/Short Trade Setup Suggestions:
Long: Entry at $78,800–$79,500 (scale in on a retest) or on a breakout above $81,200. Stop-loss: below $78,500. Targets: TP1 $82,000; TP2 $83,500–$85,000.
Short (at higher levels/on a rebound): Entry at $81,400–$82,200. Stop-loss: if price holds above $83,000. Targets: TP1 $79,800; TP2 $78,200–$76,500.
Trading Plan: The primary approach is to wait for confirmation that price is holding above $80.5K, then scale into longs, or go long on a break above $81.2K. Consider a small short position at higher levels. Risk 1–2% per trade, with leverage ≤5x. Use strict stop-losses and watch the key levels at $80.5K and $79.5K.
(For reference only; not investment advice)$BTC
{future}(BTCUSDT)
$BTC Long/Short Views + Liquidation Map + Trade Setup Suggestions + Technical Analysis (2026.10.27 13:10)
Technical Analysis: Early Tuesday, BTC continued to trade below $80K after dipping below that level over the weekend and recovering. The daily range remains $79.5–87K. Resistance is at $81–82K, with support at $79.5–80K. ETF flows turned positive on Monday, at around $110 million; weekly flows had previously remained net positive. The weekly Stochastic RSI has formed a bearish crossover, while the short-term RSI is neutral to weak. The FVG has been partially mitigated. If BTC can hold above $80.5K in the short term, a rebound is possible; a renewed break below $79.5K would increase the risk of a drop to $78–76.5K. Confirmation that support is holding is needed.
Long/Short Views: Bulls: See $79.5–80K as a reasonable accumulation zone. Short-term holder profitability has fallen to 70%, offering a better entry window; some are still holding long positions. Bears/Cautious View: Consecutive weekly closes lower and a drop back into the range point to a bearish short-term outlook. If support breaks, BTC could fall toward $76K.
Key Liquidation Map Levels: Dense short liquidation zone above: around $81,300 and $84,000–$87,000. Long liquidation zone below: around $78,800; the $79,500–$80,000 zone has already seen substantial liquidations.
Long/Short Trade Setup Suggestions:
Long: Entry at $78,800–$79,500 (scale in on a retest) or on a breakout above $81,200. Stop-loss: below $78,500. Targets: TP1 $82,000; TP2 $83,500–$85,000.
Short (at higher levels/on a rebound): Entry at $81,400–$82,200. Stop-loss: if price holds above $83,000. Targets: TP1 $79,800; TP2 $78,200–$76,500.
Trading Plan: The primary approach is to wait for confirmation that price is holding above $80.5K, then scale into longs, or go long on a break above $81.2K. Consider a small short position at higher levels. Risk 1–2% per trade, with leverage ≤5x. Use strict stop-losses and watch the key levels at $80.5K and $79.5K.
(For reference only; not investment advice)$BTC
73
·
--
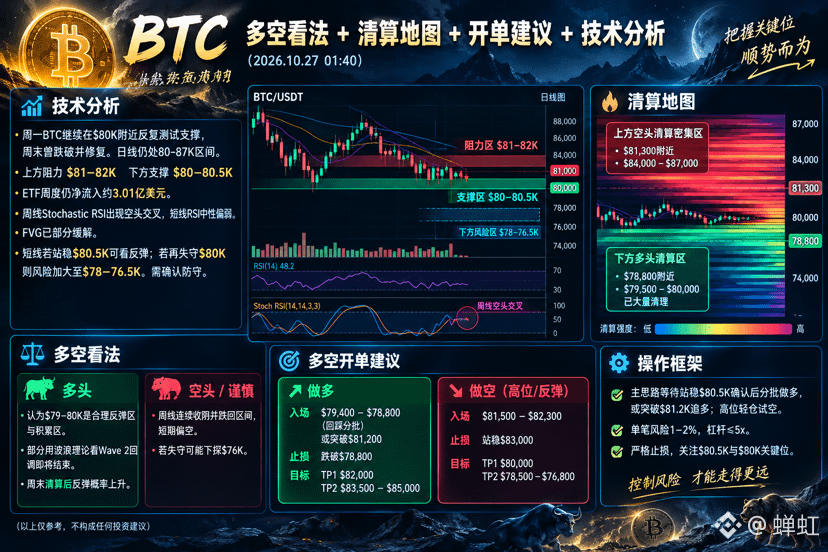
$BTC Long/Short Outlook + Liquidation Map + Trade Entry Suggestions + Technical Analysis (2026.10.27 01:50)
Technical Analysis: On Monday, BTC continued to repeatedly test support near $80K after dipping below it over the weekend and recovering. The daily chart remains within the $80–87K range. Resistance is at $81–82K, with support at $80–80.5K. Weekly ETF flows remain net positive at around $301 million. The weekly Stochastic RSI has formed a bearish crossover, while the short-term RSI is neutral to weak. The FVG has partially filled. If BTC holds above $80.5K in the short term, a rebound is possible; if it loses $80K again, the risk of a drop to $78–76.5K increases. Confirmation of support is needed.
Long/Short Outlook: Bullish view: $79–80K is considered a reasonable rebound and accumulation zone. Some wave-theory analysts see the Wave 2 pullback nearing its end, with the likelihood of a rebound rising after the weekend's liquidations. Bearish/Cautious view: Consecutive weekly closes lower and a drop back into the range point to short-term weakness; if support breaks, BTC may fall toward $76K.
Key Points from the Liquidation Map: Dense short liquidation zone above: around $81,300 and $84,000–$87,000. Long liquidation zones below: around $78,800; much of the liquidity at $79,500–$80,000 has already been cleared.
Long/Short Trade Entry Suggestions:
Long: Entry at $79,400–$78,800 (scale in on a retest) or on a breakout above $81,200. Stop-loss: below $78,800. Targets: TP1 $82,000; TP2 $83,500–$85,000.
Short (at higher levels/on a rebound): Entry at $81,500–$82,300. Stop-loss: once price holds above $83,000. Targets: TP1 $80,000; TP2 $78,500–$76,800.
Trading Plan: The main approach is to wait for confirmation that price holds above $80.5K, then enter longs in stages, or go long on a breakout above $81.2K. Consider a small short position at higher levels. Risk 1–2% per trade, with leverage of no more than 5x. Use strict stop-losses and watch the key levels at $80.5K and $80K.
(For reference only; not investment advice.)
{future}(BTCUSDT)
$BTC Long/Short Outlook + Liquidation Map + Trade Entry Suggestions + Technical Analysis (2026.10.27 01:50)
Technical Analysis: On Monday, BTC continued to repeatedly test support near $80K after dipping below it over the weekend and recovering. The daily chart remains within the $80–87K range. Resistance is at $81–82K, with support at $80–80.5K. Weekly ETF flows remain net positive at around $301 million. The weekly Stochastic RSI has formed a bearish crossover, while the short-term RSI is neutral to weak. The FVG has partially filled. If BTC holds above $80.5K in the short term, a rebound is possible; if it loses $80K again, the risk of a drop to $78–76.5K increases. Confirmation of support is needed.
Long/Short Outlook: Bullish view: $79–80K is considered a reasonable rebound and accumulation zone. Some wave-theory analysts see the Wave 2 pullback nearing its end, with the likelihood of a rebound rising after the weekend's liquidations. Bearish/Cautious view: Consecutive weekly closes lower and a drop back into the range point to short-term weakness; if support breaks, BTC may fall toward $76K.
Key Points from the Liquidation Map: Dense short liquidation zone above: around $81,300 and $84,000–$87,000. Long liquidation zones below: around $78,800; much of the liquidity at $79,500–$80,000 has already been cleared.
Long/Short Trade Entry Suggestions:
Long: Entry at $79,400–$78,800 (scale in on a retest) or on a breakout above $81,200. Stop-loss: below $78,800. Targets: TP1 $82,000; TP2 $83,500–$85,000.
Short (at higher levels/on a rebound): Entry at $81,500–$82,300. Stop-loss: once price holds above $83,000. Targets: TP1 $80,000; TP2 $78,500–$76,800.
Trading Plan: The main approach is to wait for confirmation that price holds above $80.5K, then enter longs in stages, or go long on a breakout above $81.2K. Consider a small short position at higher levels. Risk 1–2% per trade, with leverage of no more than 5x. Use strict stop-losses and watch the key levels at $80.5K and $80K.
(For reference only; not investment advice.)
56
·
--
BTC Bullish/Bearish Outlook + Liquidation Map + Trade Entry Suggestions + Technical Analysis (2026.10.26 09:10)
Technical analysis: On Sunday, BTC traded around $80K, briefly breaking below that level over the weekend before quickly recovering. The daily chart remains in the $80K–$87K range. Resistance is at $81K–$82K, with support at $80K–$80.5K. Weekly ETF flows remain positive, with net inflows of about $301 million. The 4H RSI has recovered from oversold territory but remains weak; indicators are showing signs of stabilizing. The FVG has partially filled. In the short term, holding above $80.5K could lead to a rebound; another break below $80K would increase the risk of a move down to $78K–$79K. Confirmation of support is needed.
Bullish/Bearish outlook: Bulls: View $80K as a key support and accumulation zone. A rebound is more likely following weekend liquidations, and some traders are still holding long positions. Bears/Cautious traders: BTC has fallen below the 50-day moving average; if it fails to hold above it, the decline could continue.
Key points from the liquidation map: Dense short liquidation zone above: $84,000–$87,000. Long liquidation zone below: $79,500–$80,000 has been largely cleared; some liquidity remains lower down at $78K–$79K.
Long/short trade suggestions:
Long: Entry at $79,000–$80,000 (scale in on a retest) or on a breakout above $81,200. Stop-loss: below $79,200. Targets: TP1 $82,500; TP2 $84,000–$85,500.
Short (at higher levels/on a rebound): Entry at $81,800–$82,500. Stop-loss: once price holds above $83,200. Targets: TP1 $80,200; TP2 $78,800–$77,800.
Trading framework: The primary approach is to wait for confirmation that price is holding above $80.5K, then scale into longs, or go long on a breakout above $81.2K; consider small short positions at higher levels. Risk 1–2% per trade, with leverage ≤5x. Use strict stop-losses and watch the key levels at $80.5K and $80K.$BTC
{future}(BTCUSDT)
BTC Bullish/Bearish Outlook + Liquidation Map + Trade Entry Suggestions + Technical Analysis (2026.10.26 09:10)
Technical analysis: On Sunday, BTC traded around $80K, briefly breaking below that level over the weekend before quickly recovering. The daily chart remains in the $80K–$87K range. Resistance is at $81K–$82K, with support at $80K–$80.5K. Weekly ETF flows remain positive, with net inflows of about $301 million. The 4H RSI has recovered from oversold territory but remains weak; indicators are showing signs of stabilizing. The FVG has partially filled. In the short term, holding above $80.5K could lead to a rebound; another break below $80K would increase the risk of a move down to $78K–$79K. Confirmation of support is needed.
Bullish/Bearish outlook: Bulls: View $80K as a key support and accumulation zone. A rebound is more likely following weekend liquidations, and some traders are still holding long positions. Bears/Cautious traders: BTC has fallen below the 50-day moving average; if it fails to hold above it, the decline could continue.
Key points from the liquidation map: Dense short liquidation zone above: $84,000–$87,000. Long liquidation zone below: $79,500–$80,000 has been largely cleared; some liquidity remains lower down at $78K–$79K.
Long/short trade suggestions:
Long: Entry at $79,000–$80,000 (scale in on a retest) or on a breakout above $81,200. Stop-loss: below $79,200. Targets: TP1 $82,500; TP2 $84,000–$85,500.
Short (at higher levels/on a rebound): Entry at $81,800–$82,500. Stop-loss: once price holds above $83,200. Targets: TP1 $80,200; TP2 $78,800–$77,800.
Trading framework: The primary approach is to wait for confirmation that price is holding above $80.5K, then scale into longs, or go long on a breakout above $81.2K; consider small short positions at higher levels. Risk 1–2% per trade, with leverage ≤5x. Use strict stop-losses and watch the key levels at $80.5K and $80K.$BTC
79
·
--
$BTC Bullish/Bearish Outlook + Liquidation Map + Trade Suggestions + Technical Analysis (2026.10.25 19:10)
Technical Analysis: On Sunday, BTC traded around $80K, after briefly dipping below that level over the weekend before quickly recovering. The daily chart remains within the $80K–$87K range. Resistance is at $81K–$82K, with support at $80K–$80.5K. Weekly ETF flows remain positive, with net inflows of about $301 million. The 4H RSI has recovered from oversold territory, and indicators are showing signs of stabilization. The FVG has been partially mitigated. In the short term, holding above $80.5K could allow for a rebound; losing $80K again would increase the risk of a move down to $78K–$79K. Confirmation of support is needed.
Bullish/Bearish Outlook: Bulls: Consider $80K a key support and accumulation zone. The chance of a rebound has increased following weekend liquidations, and some are still holding long positions. Bears/Cautious traders: BTC has fallen below the 50-day moving average; if it fails to reclaim and hold above it, it could continue lower.
Key Points from the Liquidation Map: Dense short-liquidation zone above: $84,000–$87,000. Long-liquidation zone below: $79,500–$80,000 has already been largely cleared, while some liquidity remains lower down at $78K–$79K.
Trade Suggestions:
Long: Entry at $80,000–$80,600 (scale in on a retest) or on a breakout above $81,200. Stop-loss: below $79,200. Targets: TP1 $82,500; TP2 $84,000–$85,500.
Short (at higher levels/on a rebound): Entry at $81,800–$82,500. Stop-loss: if price holds above $83,200. Targets: TP1 $80,200; TP2 $78,800–$77,800.
Trading Framework: The main approach is to wait for confirmation that price is holding above $80.5K, then scale into longs, or go long on a breakout above $81.2K; consider small short positions at higher levels. Risk 1–2% per trade, with leverage of no more than 5x. Use strict stop-losses and watch the key $80.5K and $80K levels.
(For reference only; not investment advice.)
{future}(BTCUSDT)
$BTC Bullish/Bearish Outlook + Liquidation Map + Trade Suggestions + Technical Analysis (2026.10.25 19:10)
Technical Analysis: On Sunday, BTC traded around $80K, after briefly dipping below that level over the weekend before quickly recovering. The daily chart remains within the $80K–$87K range. Resistance is at $81K–$82K, with support at $80K–$80.5K. Weekly ETF flows remain positive, with net inflows of about $301 million. The 4H RSI has recovered from oversold territory, and indicators are showing signs of stabilization. The FVG has been partially mitigated. In the short term, holding above $80.5K could allow for a rebound; losing $80K again would increase the risk of a move down to $78K–$79K. Confirmation of support is needed.
Bullish/Bearish Outlook: Bulls: Consider $80K a key support and accumulation zone. The chance of a rebound has increased following weekend liquidations, and some are still holding long positions. Bears/Cautious traders: BTC has fallen below the 50-day moving average; if it fails to reclaim and hold above it, it could continue lower.
Key Points from the Liquidation Map: Dense short-liquidation zone above: $84,000–$87,000. Long-liquidation zone below: $79,500–$80,000 has already been largely cleared, while some liquidity remains lower down at $78K–$79K.
Trade Suggestions:
Long: Entry at $80,000–$80,600 (scale in on a retest) or on a breakout above $81,200. Stop-loss: below $79,200. Targets: TP1 $82,500; TP2 $84,000–$85,500.
Short (at higher levels/on a rebound): Entry at $81,800–$82,500. Stop-loss: if price holds above $83,200. Targets: TP1 $80,200; TP2 $78,800–$77,800.
Trading Framework: The main approach is to wait for confirmation that price is holding above $80.5K, then scale into longs, or go long on a breakout above $81.2K; consider small short positions at higher levels. Risk 1–2% per trade, with leverage of no more than 5x. Use strict stop-losses and watch the key $80.5K and $80K levels.
(For reference only; not investment advice.)
54
·
--
$BTC Bull/Bear Views + Liquidation Map + Trade Entry Suggestions + Technical Analysis (2026.10.25 10:20)
Technical Analysis: After BTC fell below $80K on Saturday, it quickly rebounded to $80.7–80.8K. The daily chart remains within the $80–87K range. Resistance is at $81–82K, with support at $80–80.5K. ETFs saw continued net outflows of about $138 million yesterday. The 4H RSI has recovered from oversold territory, and indicators show signs of stabilizing. The FVG has been partially filled. In the short term, a hold above $80.5K could support a rebound; losing $80K again would increase risk. Confirmation of support is needed.
Bull/Bear Views: Bulls: They believe the drop below $80K was a liquidation sweep, and that the chance of a rebound has increased after oversold conditions; some are adding to positions around $80–81K. Bears/Cautious: ETF outflows continue and the structure has not fully recovered; if price cannot hold, it may continue lower.
Key Liquidation Map Levels: Dense short liquidation zone above: $84,000–$87,000. Long liquidation zone below: $79,500–$80,000 has been largely cleared; some liquidations remain deeper at $78–79K.
Bull/Bear Trade Entry Suggestions:
Long: Entry at $80,300–$80,800 (scale in on a pullback) or on a breakout above $81,500. Stop-loss: below $79,500. Targets: TP1 $82,500; TP2 $84,000–$85,500.
Short (at higher levels/on a rebound): Entry at $82,000–$82,800. Stop-loss: once price holds above $83,500. Targets: TP1 $80,500; TP2 $79,000–$78,000.
Trading Framework: The main approach is to wait for confirmation of a hold above $80.5K before scaling into longs, or go long on a breakout above $81.5K; consider small short positions at higher levels. Risk 1–2% per trade, leverage ≤5x. Use strict stop-losses and watch the key levels at $80.5K and $80K.
(For reference only; not investment advice)
72
·
--
BTC Bullish/Bearish Outlook + Liquidation Map + Trade Entry Suggestions + Technical Analysis (2026.10.25 01:50)
Technical Analysis: On Saturday, BTC fell below $80K and quickly cleared liquidity below. The current price is fluctuating between $79.6K and $80.1K. The daily chart remains within the $80K–$87K range. Resistance above is at $81K–$82K, with support below at $79.5K–$80K. ETFs continued to see net outflows yesterday, totaling about $138 million. The 4H RSI entered oversold territory (around 28); after short-term indicators weakened, a recovery followed. The FVG near $80.2K has eased. In the short term, a move back above $80.5K could signal a rebound; losing $79.5K again would increase risk. Confirmation that support is holding is needed.
Bullish/Bearish Outlook: Bulls: They believe the drop below $80K was a bear trap, and that the likelihood of an oversold rebound has increased after liquidations. Some have already opened long positions. Bears/Cautious traders: ETF outflows continue, and the structure has not fully recovered. If BTC cannot reclaim $80K, it may continue lower.
Key Points on the Liquidation Map: Dense short liquidation zone above: $84,000–$87,000. Long liquidation zone below: $79,500–$80,000 has already been largely cleared; some liquidity remains lower, around $78K–$79K.
Long/Short Trade Suggestions:
Long: Entry at $79,600–$80,200 (scale in on a retest) or on a breakout above $80,800. Stop-loss: below $79,000. Targets: TP1 $82,000; TP2 $83,500–$85,000.
Short (at higher levels/on a rebound): Entry at $81,800–$82,500. Stop-loss: once price holds above $83,200. Targets: TP1 $80,000; TP2 $78,500–$77,800.
Trading Framework: The main approach is to wait for confirmation of a move back above $80K–$80.5K before scaling into longs, or go long on a breakout above $81K; consider a small short position at higher levels. Risk 1–2% per trade, with leverage of no more than 5x. Use strict stop-losses and watch the key levels at $80K and $79.5K.
(For reference only; not investment advice)$BTC
{future}(BTCUSDT)
BTC Bullish/Bearish Outlook + Liquidation Map + Trade Entry Suggestions + Technical Analysis (2026.10.25 01:50)
Technical Analysis: On Saturday, BTC fell below $80K and quickly cleared liquidity below. The current price is fluctuating between $79.6K and $80.1K. The daily chart remains within the $80K–$87K range. Resistance above is at $81K–$82K, with support below at $79.5K–$80K. ETFs continued to see net outflows yesterday, totaling about $138 million. The 4H RSI entered oversold territory (around 28); after short-term indicators weakened, a recovery followed. The FVG near $80.2K has eased. In the short term, a move back above $80.5K could signal a rebound; losing $79.5K again would increase risk. Confirmation that support is holding is needed.
Bullish/Bearish Outlook: Bulls: They believe the drop below $80K was a bear trap, and that the likelihood of an oversold rebound has increased after liquidations. Some have already opened long positions. Bears/Cautious traders: ETF outflows continue, and the structure has not fully recovered. If BTC cannot reclaim $80K, it may continue lower.
Key Points on the Liquidation Map: Dense short liquidation zone above: $84,000–$87,000. Long liquidation zone below: $79,500–$80,000 has already been largely cleared; some liquidity remains lower, around $78K–$79K.
Long/Short Trade Suggestions:
Long: Entry at $79,600–$80,200 (scale in on a retest) or on a breakout above $80,800. Stop-loss: below $79,000. Targets: TP1 $82,000; TP2 $83,500–$85,000.
Short (at higher levels/on a rebound): Entry at $81,800–$82,500. Stop-loss: once price holds above $83,200. Targets: TP1 $80,000; TP2 $78,500–$77,800.
Trading Framework: The main approach is to wait for confirmation of a move back above $80K–$80.5K before scaling into longs, or go long on a breakout above $81K; consider a small short position at higher levels. Risk 1–2% per trade, with leverage of no more than 5x. Use strict stop-losses and watch the key levels at $80K and $79.5K.
(For reference only; not investment advice)$BTC
85
·
--
$BTC Long/Short Outlook + Liquidation Map + Trade Setup + Technical Analysis (2026.10.24 11:20)
Technical Analysis: On Friday evening, BTC tested the key $80.8–81K support again. The daily chart remains within the $80–87K range. Resistance is at $82–83K, with support at $80–81.5K. ETFs saw net outflows of around $635 million yesterday, with outflows continuing at a modest pace today. Whale activity shows signals of both transfers and buying. RSI is showing early bearish momentum, and indicators are broadly weak. In the short term, holding above $80K could lead to a rebound; a break below it would increase downside risk toward $79–78K. Confirmation of support is needed.
Long/Short Outlook: Bulls: Believe the $80–81K support will hold; some have already added to positions at $80.8K and expect a rebound. Bears/Cautious traders: ETF outflows are weighing on the market, and RSI is weak; a break below $80K would confirm a deeper correction.
Key Liquidation Map Levels: Dense short liquidation zone above: $84,000–$87,000. Long liquidation zones below: $80,000–$81,500, with a deeper zone at $79–78K.
Long/Short Trade Setup:
Long: Entry at $80,500–$81,200 (scale in on a retest) or on a breakout above $82,300. Stop-loss: below $79,800. Targets: TP1 $83,000; TP2 $84,500–$86,000.
Short (at higher levels/on a rebound): Entry at $82,800–$83,500. Stop-loss: sustained move above $84,200. Targets: TP1 $81,000; TP2 $79,500–$78,500.
Trading Plan: The main approach is to wait for confirmation that $80–81K support is holding, then scale into longs, or go long on a breakout above $82.3K; consider a small short position at higher levels. Risk 1–2% per trade, with leverage of no more than 5x. Use strict stop-losses and watch the key $80K and $82K levels.
(For reference only; not investment advice)
64
·
--
$BTC Long/short outlook + liquidation map + trade setup suggestions + technical analysis (2026.10.24 00:00)
Technical analysis: On Friday, BTC traded within the $81–82K decision zone. The daily chart remains in the $80–87K range. Resistance above: $82.1–84K; support below: $81–81.5K. ETFs saw net outflows of about $635 million yesterday, reversing the inflows of the previous few days. Whales have been buying consecutively, while there are also signs of transfers to exchanges. Indicators are neutral, and an imbalance remains above the FVG. In the short term, a break above $82.1K could signal a rebound; a drop below $81K would increase risk. Direction needs confirmation.
Long/short outlook: Bulls: Believe the $81–81.5K support will hold, with whale buying supporting buying on dips. Bears/cautious view: ETF outflows have added pressure. A breakout needs confirmation; otherwise, price could continue lower.
Key points from the liquidation map: Dense short-liquidation zone above: $84,000–$87,000. Long-liquidation zones below: $80,000–$81,500, and further down at $79–80K.
Long/short trade suggestions:
Long: Entry at $81,000–$81,500 (scale in on a retest) or on a breakout above $82,300. Stop-loss: below $80,500. Targets: TP1 $84,000; TP2 $85,500–$87,000.
Short (at higher levels/on a rebound): Entry at $83,500–$84,500. Stop-loss: if price holds above $85,200. Targets: TP1 $81,500; TP2 $80,500–$79,800.
Trading framework: The main strategy is to wait for a retest of $81–81.5K and scale into longs, or go long on a breakout above $82.3K; try small short positions at higher levels. Risk 1–2% per trade, leverage ≤5x. Use strict stop-losses and watch the key levels at $82.1K and $81K.
(For reference only; not investment advice.)
{future}(BTCUSDT)
$BTC Long/short outlook + liquidation map + trade setup suggestions + technical analysis (2026.10.24 00:00)
Technical analysis: On Friday, BTC traded within the $81–82K decision zone. The daily chart remains in the $80–87K range. Resistance above: $82.1–84K; support below: $81–81.5K. ETFs saw net outflows of about $635 million yesterday, reversing the inflows of the previous few days. Whales have been buying consecutively, while there are also signs of transfers to exchanges. Indicators are neutral, and an imbalance remains above the FVG. In the short term, a break above $82.1K could signal a rebound; a drop below $81K would increase risk. Direction needs confirmation.
Long/short outlook: Bulls: Believe the $81–81.5K support will hold, with whale buying supporting buying on dips. Bears/cautious view: ETF outflows have added pressure. A breakout needs confirmation; otherwise, price could continue lower.
Key points from the liquidation map: Dense short-liquidation zone above: $84,000–$87,000. Long-liquidation zones below: $80,000–$81,500, and further down at $79–80K.
Long/short trade suggestions:
Long: Entry at $81,000–$81,500 (scale in on a retest) or on a breakout above $82,300. Stop-loss: below $80,500. Targets: TP1 $84,000; TP2 $85,500–$87,000.
Short (at higher levels/on a rebound): Entry at $83,500–$84,500. Stop-loss: if price holds above $85,200. Targets: TP1 $81,500; TP2 $80,500–$79,800.
Trading framework: The main strategy is to wait for a retest of $81–81.5K and scale into longs, or go long on a breakout above $82.3K; try small short positions at higher levels. Risk 1–2% per trade, leverage ≤5x. Use strict stop-losses and watch the key levels at $82.1K and $81K.
(For reference only; not investment advice.)
49
·
--
$BTC Trading Recommendations + Technical Analysis (2026.10.23
1.2:00)
Technical Analysis: On Thursday, BTC pulled back from $85K to around $81K. Approximately $450 million in leveraged longs near the highs were liquidated. Resistance is at $84–85K, with support at $80–81.5K. ETFs have seen cumulative inflows of over $1 billion this week, as institutions bought during the weakness. On-chain whale activity is high, and the market structure is cleaner after the liquidations. If BTC holds $80–81.5K in the short term, a rebound is possible; if it breaks below that range, risk will increase. Support needs to be confirmed.
Bullish and bearish outlook:
Bulls: Believe that $80–81.5K support will hold; strong ETF inflows and the clearing of leveraged positions support buying the dip.
Bears / Cautious view: Resistance remains in the short term. After a failed rally, support needs to be confirmed; otherwise, prices may continue to fall.
Key liquidation map levels:
Dense short liquidation zone above: $84,000–$87,000
Long liquidation zones below: $80,000–$81,500, and deeper at $79–80K
Long and short trade recommendations:
Long: Entry $80,500–$81,500 or on a breakout above $83,500. Stop-loss: below $79,800. Targets: TP1 $84,000; TP2 $85,500–$87,000.
Short: Entry $83,800–$84,800. Stop-loss: if price holds above $85,500. Targets: TP1 $81,500; TP2 $80,500–$79,800.
{future}(BTCUSDT)
$BTC Trading Recommendations + Technical Analysis (2026.10.23
1.2:00)
Technical Analysis: On Thursday, BTC pulled back from $85K to around $81K. Approximately $450 million in leveraged longs near the highs were liquidated. Resistance is at $84–85K, with support at $80–81.5K. ETFs have seen cumulative inflows of over $1 billion this week, as institutions bought during the weakness. On-chain whale activity is high, and the market structure is cleaner after the liquidations. If BTC holds $80–81.5K in the short term, a rebound is possible; if it breaks below that range, risk will increase. Support needs to be confirmed.
Bullish and bearish outlook:
Bulls: Believe that $80–81.5K support will hold; strong ETF inflows and the clearing of leveraged positions support buying the dip.
Bears / Cautious view: Resistance remains in the short term. After a failed rally, support needs to be confirmed; otherwise, prices may continue to fall.
Key liquidation map levels:
Dense short liquidation zone above: $84,000–$87,000
Long liquidation zones below: $80,000–$81,500, and deeper at $79–80K
Long and short trade recommendations:
Long: Entry $80,500–$81,500 or on a breakout above $83,500. Stop-loss: below $79,800. Targets: TP1 $84,000; TP2 $85,500–$87,000.
Short: Entry $83,800–$84,800. Stop-loss: if price holds above $85,500. Targets: TP1 $81,500; TP2 $80,500–$79,800.
9
·
--
$BTC Trade Entry Recommendations + Technical Analysis (2026.10.21
09:10)
Technical Analysis: BTC rebounded strongly on Tuesday evening, moving above the $83K level. ETFs saw significant net inflows yesterday. Resistance is at $83.5–84.5K, with support at $81.5–82K. The liquidation map shows the price nearing an upper short-liquidation zone; a short-term breakout could trigger a squeeze. Confirmation is needed that BTC can hold above $83.5K. If it does, it may challenge $85K; if it pulls back below $82K, the risk will increase.
Liquidation Map: Dense upper short-liquidation zone: $83,500–$84,500. Lower long-liquidation zone: $81,500–$82,000, with a deeper zone at $80.5–81K.
Long/Short Trade Recommendations:
Long: Entry at $82,500–$83,000 (scale in on a pullback) or on a breakout above $83,800. Stop-loss: below $81,800. Targets: TP1 $85,000; TP2 $86,500–$87,500.
Short (at highs/on a rebound): Entry at $84,200–$84,800. Stop-loss: if price holds above $85,500. Targets: TP1 $82,800; TP2 $81,800–$81,000.
Trading Plan: The primary approach is to wait for a pullback to $82.5–83K and scale into longs, or go long on a breakout above $83.8K; consider a small short position near the highs. Risk 1–2% per trade, with leverage ≤5x. Watch the key levels of $83.5K and $82K.
{future}(BTCUSDT)
$BTC Trade Entry Recommendations + Technical Analysis (2026.10.21
09:10)
Technical Analysis: BTC rebounded strongly on Tuesday evening, moving above the $83K level. ETFs saw significant net inflows yesterday. Resistance is at $83.5–84.5K, with support at $81.5–82K. The liquidation map shows the price nearing an upper short-liquidation zone; a short-term breakout could trigger a squeeze. Confirmation is needed that BTC can hold above $83.5K. If it does, it may challenge $85K; if it pulls back below $82K, the risk will increase.
Liquidation Map: Dense upper short-liquidation zone: $83,500–$84,500. Lower long-liquidation zone: $81,500–$82,000, with a deeper zone at $80.5–81K.
Long/Short Trade Recommendations:
Long: Entry at $82,500–$83,000 (scale in on a pullback) or on a breakout above $83,800. Stop-loss: below $81,800. Targets: TP1 $85,000; TP2 $86,500–$87,500.
Short (at highs/on a rebound): Entry at $84,200–$84,800. Stop-loss: if price holds above $85,500. Targets: TP1 $82,800; TP2 $81,800–$81,000.
Trading Plan: The primary approach is to wait for a pullback to $82.5–83K and scale into longs, or go long on a breakout above $83.8K; consider a small short position near the highs. Risk 1–2% per trade, with leverage ≤5x. Watch the key levels of $83.5K and $82K.
53
·
--
$BTC Trade Setup Recommendations + Technical Analysis (2026.10.20 01:21)
Technical Analysis: On Monday, $BTC traded around $82K, meeting resistance after rebounding from the weekend low. Price repeatedly tested the area near the ETF cost basis, with resistance at $83–83.5K and support at $80.6–81.5K. On-chain whales continued to withdraw net amounts from exchanges. The liquidation map shows price approaching an upper short-liquidation zone, so a short-term breakout could trigger a squeeze. If price holds firm, it may challenge $84–85K; a drop below $81.5K would increase risk.
Liquidation Map: Dense short-liquidation zone above: $83,000–$83,500. Long-liquidation zones below: $80,600–$81,600, and deeper at $80–79K.
Long/Short Trade Setup Recommendations:
Long: Entry $81,000–$81,600; stop-loss below $80,700; targets: TP1 $84,200, TP2 $85,000–$86,000.
Short: Entry $83,400–$84,000; stop-loss if price holds above $84,500; targets: TP1 $82,000, TP2 $81,000–$80,500.
Trading Plan: The main approach is to wait for a pullback to $81.6–82.2K and enter long in several batches, or go long on a breakout above $83.2K; consider a small short position at higher levels. Risk 1–2% per trade, with leverage ≤5x. Use strict stop-losses and watch the key levels at $83K and $80.6K.
{future}(BTCUSDT)
$BTC Trade Setup Recommendations + Technical Analysis (2026.10.20 01:21)
Technical Analysis: On Monday, $BTC traded around $82K, meeting resistance after rebounding from the weekend low. Price repeatedly tested the area near the ETF cost basis, with resistance at $83–83.5K and support at $80.6–81.5K. On-chain whales continued to withdraw net amounts from exchanges. The liquidation map shows price approaching an upper short-liquidation zone, so a short-term breakout could trigger a squeeze. If price holds firm, it may challenge $84–85K; a drop below $81.5K would increase risk.
Liquidation Map: Dense short-liquidation zone above: $83,000–$83,500. Long-liquidation zones below: $80,600–$81,600, and deeper at $80–79K.
Long/Short Trade Setup Recommendations:
Long: Entry $81,000–$81,600; stop-loss below $80,700; targets: TP1 $84,200, TP2 $85,000–$86,000.
Short: Entry $83,400–$84,000; stop-loss if price holds above $84,500; targets: TP1 $82,000, TP2 $81,000–$80,500.
Trading Plan: The main approach is to wait for a pullback to $81.6–82.2K and enter long in several batches, or go long on a breakout above $83.2K; consider a small short position at higher levels. Risk 1–2% per trade, with leverage ≤5x. Use strict stop-losses and watch the key levels at $83K and $80.6K.
22
·
--
$BTC Trading Entry Suggestions + Technical Analysis (2026.10.16 1:10)
Technical Analysis: Price pulled back from $82.8K to consolidate around $81.5K, making $81K support critical. The ETF cost basis of around $81.5K is being tested, while the daily chart remains in the $80–87K range. Resistance is at $82.5–83.5K, with support at $80–81K. The liquidation map shows nearby liquidation zones above and below, pointing to increased short-term volatility. It remains to be seen whether $81K can hold. If price holds above $82K, it could make another run at $83.5K; if it breaks below $81K, the risk increases.
Liquidation Map: Dense short liquidation zone above: $81,800–$82,800. Long liquidation zones below: $80,000–$81,100, with deeper zones at $79–78K.
Long/Short Entry Suggestions:
Long: Entry at $81,000–$81,500 (scale in on a pullback), or on a breakout above $82,300. Stop-loss: below $80,300. Targets: TP1 $82,800; TP2 $84,000–$85,000.
Short (at higher levels/on a rebound): Entry at $82,500–$83,200. Stop-loss: if price holds above $83,800. Targets: TP1 $81,200; TP2 $80,000–$79,500.
Trading Plan: The primary approach is to wait for a pullback to $81–81.5K and scale into a long, or go long on a breakout above $82.3K; consider a small short position at higher levels. Risk 1–2% per trade, leverage ≤5x.
{future}(BTCUSDT)
$BTC Trading Entry Suggestions + Technical Analysis (2026.10.16 1:10)
Technical Analysis: Price pulled back from $82.8K to consolidate around $81.5K, making $81K support critical. The ETF cost basis of around $81.5K is being tested, while the daily chart remains in the $80–87K range. Resistance is at $82.5–83.5K, with support at $80–81K. The liquidation map shows nearby liquidation zones above and below, pointing to increased short-term volatility. It remains to be seen whether $81K can hold. If price holds above $82K, it could make another run at $83.5K; if it breaks below $81K, the risk increases.
Liquidation Map: Dense short liquidation zone above: $81,800–$82,800. Long liquidation zones below: $80,000–$81,100, with deeper zones at $79–78K.
Long/Short Entry Suggestions:
Long: Entry at $81,000–$81,500 (scale in on a pullback), or on a breakout above $82,300. Stop-loss: below $80,300. Targets: TP1 $82,800; TP2 $84,000–$85,000.
Short (at higher levels/on a rebound): Entry at $82,500–$83,200. Stop-loss: if price holds above $83,800. Targets: TP1 $81,200; TP2 $80,000–$79,500.
Trading Plan: The primary approach is to wait for a pullback to $81–81.5K and scale into a long, or go long on a breakout above $82.3K; consider a small short position at higher levels. Risk 1–2% per trade, leverage ≤5x.
49
·
--
$BTC Trade Entry Recommendations + Technical Analysis (2026.10.16 17:40)
Technical Analysis: After today’s PPI shock, BTC rebounded in a V-shape from a low of $79.8K and stabilized near $82K. The key $80K support held. The ETF cost basis of around $81.5K was tested and then reclaimed. Resistance is at $83–84.5K, with support at $80–81.5K. The short-term outlook is recovering from the macro shock; in the medium term, holding $80K is key. If BTC holds above $83K, it may challenge $85K; another break below $81K would increase risk.
Liquidation Map: Dense short liquidation zone above: $82,500–$84,500. Long liquidation zones below: $80,000–$81,500, and deeper at $79–78K.
Long/Short Trade Entry Recommendations:
Long: Entry at $81,300–$82,100 or on a breakout above $83,200. Stop-loss below $80,500. Targets: TP1 $84,000; TP2 $85,500–$86,500.
Short (at highs/on a rebound): Entry at $83,500–$84,200. Stop-loss if price holds above $85,000. Targets: TP1 $81,800; TP2 $80,500–$79,800.
Trading Plan: The main approach is to wait for a pullback to $81.3–82.1K and scale into longs, or go long on a breakout above $83.2K; consider a small short position near the highs. Risk 1–2% per trade, leverage ≤5x. Use strict stop-losses.
{future}(BTCUSDT)
$BTC Trade Entry Recommendations + Technical Analysis (2026.10.16 17:40)
Technical Analysis: After today’s PPI shock, BTC rebounded in a V-shape from a low of $79.8K and stabilized near $82K. The key $80K support held. The ETF cost basis of around $81.5K was tested and then reclaimed. Resistance is at $83–84.5K, with support at $80–81.5K. The short-term outlook is recovering from the macro shock; in the medium term, holding $80K is key. If BTC holds above $83K, it may challenge $85K; another break below $81K would increase risk.
Liquidation Map: Dense short liquidation zone above: $82,500–$84,500. Long liquidation zones below: $80,000–$81,500, and deeper at $79–78K.
Long/Short Trade Entry Recommendations:
Long: Entry at $81,300–$82,100 or on a breakout above $83,200. Stop-loss below $80,500. Targets: TP1 $84,000; TP2 $85,500–$86,500.
Short (at highs/on a rebound): Entry at $83,500–$84,200. Stop-loss if price holds above $85,000. Targets: TP1 $81,800; TP2 $80,500–$79,800.
Trading Plan: The main approach is to wait for a pullback to $81.3–82.1K and scale into longs, or go long on a breakout above $83.2K; consider a small short position near the highs. Risk 1–2% per trade, leverage ≤5x. Use strict stop-losses.
14
·
--
$BTC Trade Setup + Technical Analysis (2026.10.14 09:10)
Technical Analysis: CPI came in hot, and $BTC pulled back from $83.8K to around $81.5K. The key $80–81.5K support zone remains intact, and the ETF cost basis at around $81.5K is being tested. Resistance is at $83–84K, with support below at $80–81K. On-chain whale holdings have rebounded, while the liquidation map shows a nearby long liquidation zone below. Hot CPI is weighing on the short term; in the medium term, holding $80K is key.
Liquidation Map: Dense short liquidation zone above: $84,000–$86,500. Long liquidation zones below: $80,000–$81,500, with a deeper zone at $79–75K.
Long/Short Trade Suggestions:
Long: Entry at $80,500–$81,500 (scale in on a pullback). Stop-loss below $79,800. Targets: TP1 $83,500; TP2 $85,000–$86,000.
Short (with the trend/at higher levels): Entry at $82,800–$83,500, or on a rebound to $84,000. Stop-loss if price holds above $84,500. Targets: TP1 $81,000; TP2 $80,000–$79,500.
Trading Plan: The main approach is to wait for a pullback to $80.5–81.5K and scale into a long position. If price breaks below $81K, consider a small short position in the direction of the trend. Risk 1–2% per trade, with leverage of no more than 5x. Use strict stop-losses and watch the $80K support.
56
Log in to explore more content
Join global crypto users on Binance Square
⚡️ Get latest and useful information about crypto.
💬 Trusted by the world’s largest crypto exchange.
👍 Discover real insights from verified creators.
Email / Phone number
Trending Topics
UniswapA16zSeekDeFiExemptionFromIllinoisCryptoTax
31,752 views
829 Discussing
#CryptoTax 🚨 CRYPTO MARKET & REGULATORY UPDATE #HKDollarStablecoinHKDAPToLaunchOnSolana
#uniswapa16zseekdefiexemptionfromillinoiscryptotax UNISWAP, a16z & DeFi Education Fund Challenge Illinois Crypto Tax Rules
October 30, 2026 | Market Volatility & Industry Developments
📊 1. MARKET SNAPSHOT
Crypto markets are showing mixed signals, with selected assets posting sharp gains while several major cryptocurrencies remain under pressure.
📈 Top reported gainers
SOPH: +60.81% — $0.00238
BEAMX: +37.94% — $0.004701
SKDDB: +16.81% — $9.38
📉 Notable reported losers
INTWUSDT: −61.09% — $6.72
AKEUSDT: −31.47% — $0.013989
SNXXUSDT: −30.71% — $6.43
🔎 Major crypto assets under pressure
DOGE: −5.06%
PEPE: −4.91%
SUI: −4.83%
NEAR: −3.28%
XRP: −3.13%
Uniswap Labs, Andreessen Horowitz (a16z), and the DeFi Education Fund (DEF) are pushing for exemptions from Illinois’
#Uniswap #a16z #DeFi #CryptoRegulation #Illinois # #Web3 #BinanceSquare
#HKDollarStablecoinHKDAPToLaunchOnSolana #HKDAP #Stablecoin #CryptoNews #Blockchain #DeFi #DigitalPayments
⚖️ 3. UNISWAP, a16z & ILLINOIS CRYPTO TAX RULES
Uniswap Labs, Andreessen Horowitz (a16z), and the DeFi Education Fund are associated with efforts to seek exemptions proposed Illinois crypto tax requirements.
The debate highlights a key question: How should tax-reporting obligations apply to decentralized that may not operate like traditional financial intermediaries?
The outcome could influence DeFi compliance, developer obligations, and the future regulatory environment.
#BinanceSquare #CryptoNews #HKDAP #Stablecoin #Uniswap #a16z #DeFi #CryptoTax
CHASEPA SULUXù
·2 Likes
·341 views
HKDollarStablecoinHKDAPToLaunchOnSolana
23,555 views
534 Discussing
$1.5BInLeveragedCryptoBetsLiquidated
50,358 views
264 Discussing