

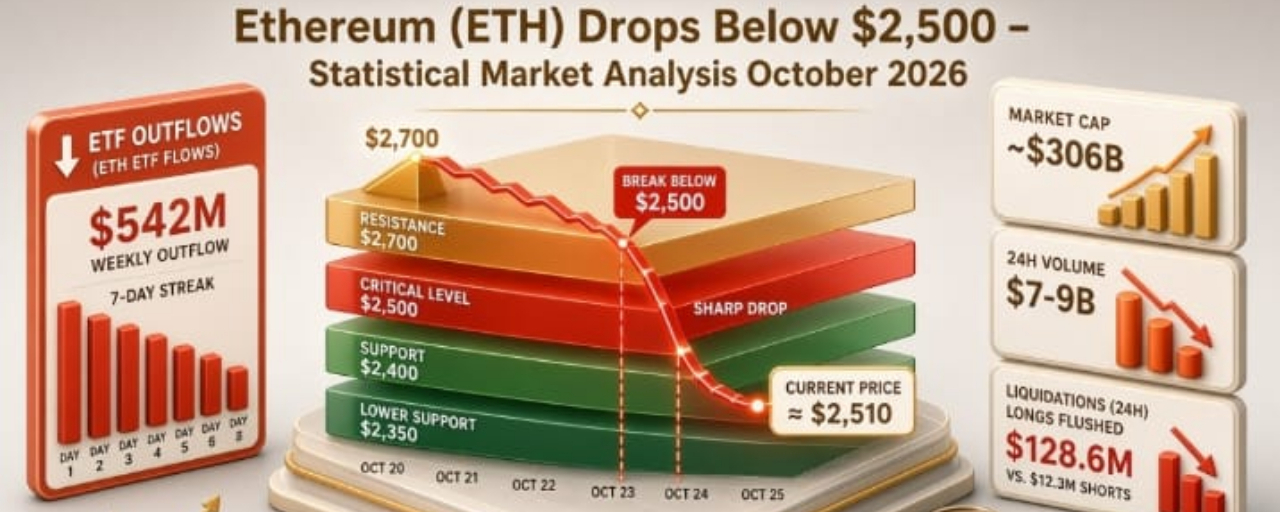

Ethereum ( $ETH ) Drops Below $2,500 – Full Analysis
Date: October 14, 2026
Asset: Ethereum (ETH/USD)
Current Price: ≈ $2,500 – $2,516 (hovering near key psychological level)
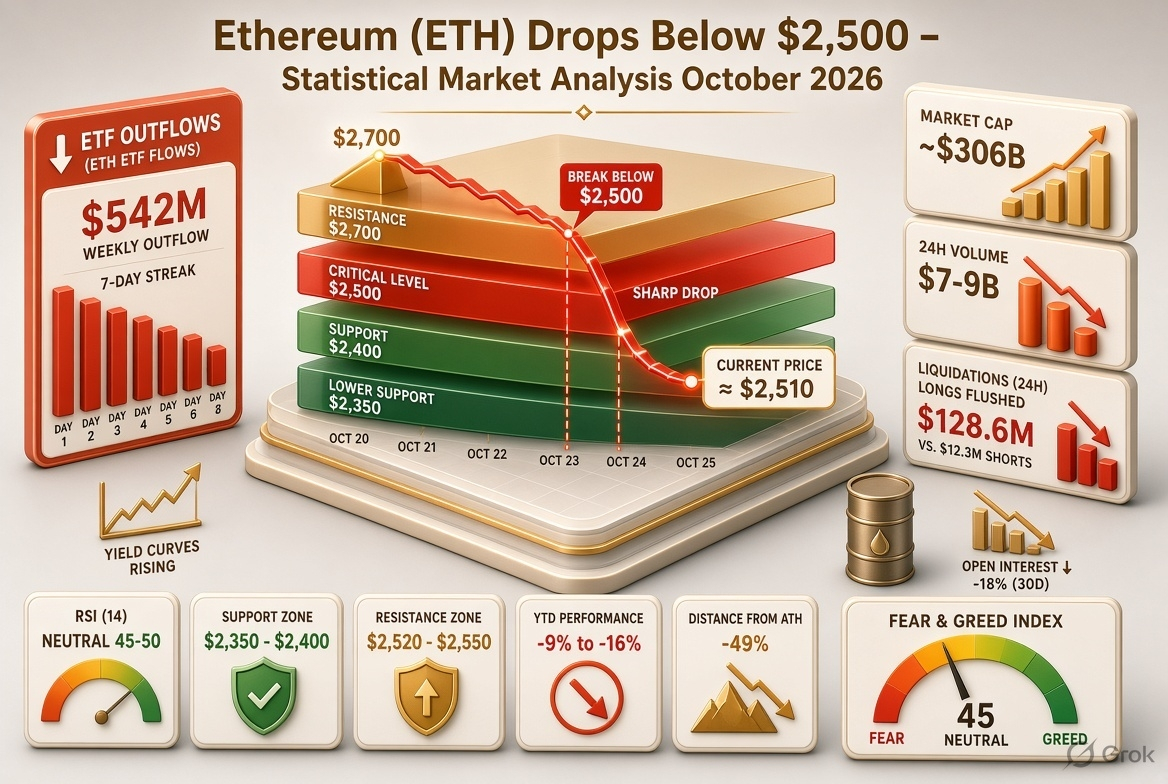
Market Cap: ≈ $306B
24h Volume: ≈ $7.4B – $8.7B
Circulating Supply: ≈ 122.13M ETH

1. Price Action & Statistical Summary
- ETH broke decisively below $2,500 in early October (around Oct 8–9) after trading above $2,700 earlier in the month.
- Recent lows tested ≈ $2,409–$2,411 (Oct 13 session).
- As of Oct 14, price is stabilizing around $2,500–$2,516 with modest positive 24h moves (+0.2% to +0.7% depending on source).
- Key performance metrics:
- 7-day change: roughly –3% to –7% (depending on exact window).
- 30-day: mixed/slightly positive in some readings, but overall pressure.
- YTD: ≈ –9% to –16%.
- From Aug 2025 ATH ($4,946): ≈ –49%.
- 24h range (recent sessions): typically $2,479–$2,530.
- RSI (14): ≈ 43–50 (Neutral).
- Price sits below 20-day MA (≈ $2,618) and near/below 50-day EMA (≈ $2,500–$2,557).
2. Key Drivers of the Decline
- US Treasury Yields:10-year yields reached multi-year highs (≈ 5.3–5.35%), increasing opportunity cost for risk assets. Higher yields + strong dollar pressured crypto broadly.
- Spot ETH ETF Outflows: Prolonged selling pressure.
- Multi-day streak of net outflows (9–10+ consecutive sessions reported).
- Weekly outflows peaked around $542M (week ending Oct 9) — largest weekly outflow since January.
- Cumulative outflows in the recent streak: ≈ $640M–$700M.
- BlackRock’s ETHA accounted for the majority of redemptions in several sessions.
- Total US spot ETH ETF AUM declined to ≈ $15.7B–$15.9B range.
-Liquidations & Leverage Flush:Significant long liquidations during the breakdown (hundreds of millions in ETH longs across sessions). Open interest declined notably (OI down ≈ 15% in some 5-day windows). Funding rates moved toward neutral/negative at times.
- Macro Backdrop:Fed hawkish signals (potential further rate action), elevated oil prices, and risk-off flows. Corporate buyer BitMine approaching its self-imposed ≈ 5% supply accumulation limit also reduced one source of steady demand.
- Secondary factors: Rising exchange reserves in some periods and thinner institutional bid.
3. Market Effects & Broader Impact
-Derivatives: Reduced open interest and leverage clearing lowered immediate crash risk but also weakened rebound momentum. Liquidation heatmaps show clustered long exposure below current levels and short exposure above (notably around $2,530–$2,630+ zones).
- Relative Performance: ETH underperformed Bitcoin in recent sessions on a relative basis (ETH/BTC ratio weakened).
- Liquidity & Volume:24h volumes remained solid ($7–9B range) but were lower than peak periods earlier in the month.
- On-chain / Institutional: ETF flows turned sharply negative after earlier positive periods. Some whale accumulation was reported even as retail/institutional ETF money exited.
- Cross-market:Correlated weakness with broader risk assets; positive correlation with equity risk-off moves and inverse sensitivity to rising yields.
4. Sentiment Analysis
- Fear & Greed (ETH-specific): Readings in the Neutral zone (≈ 41–47 range across providers as of Oct 14). Overall crypto Fear & Greed has fluctuated between Neutral and mild Greed (≈ 55–62).
- Social Sentiment:Mixed but with pockets of FOMO on ETH relative to BTC/XRP in some recent snapshots (higher bullish-to-bearish comment ratios on social platforms for ETH).
- Trader Positioning: Crowded longs were flushed earlier; current positioning shows more balanced or short-leaning bias in derivatives. Liquidation maps indicate potential short-squeeze fuel above current levels if price reclaims $2,500–$2,550 decisively.
- Overall tone: Cautious / wait-and-see. Institutional flows remain a key watchpoint; retail appears less panicked than during deeper drawdowns earlier in 2026.
5. Technical Levels to Watch
- Immediate Support:$2,480 – $2,500 (psychological + recent lows), then $2,350–$2,400 / 100-day EMA zone.
- Resistance: $2,520–$2,550, then $2,580–$2,600. Sustained reclaim of $2,500 opens path toward higher levels.
- Structure: Neutral-to-bearish short-term while below key moving averages. A daily close back above $2,500–$2,550 would improve the outlook.
6. Outlook Summary
ETH is consolidating after a macro- and flow-driven correction that took it below the important $2,500 level. Persistent ETF outflows and elevated yields remain the primary headwinds. Reduced leverage has lowered cascade risk, but a clear catalyst (improved ETF flows, cooling yields, or strong macro data) is needed for a sustained recovery.
Key upcoming catalysts: US inflation data, Fed commentary, weekly ETF flow prints, and any shifts in corporate treasury buying.
Disclaimer: This note is for informational and educational purposes only. It does not constitute financial, investment, or trading advice. Cryptocurrency markets are highly volatile. Always conduct your own research and manage risk appropriately. Data compiled from public market sources as of October 14, 2026, and subject to rapid change.
Ready for posting on exchange announcement channels, research terminals, or social platforms. Let me know if you need a shorter version, charts summary, or adjustments for a specific audience.


#StriveBuys3311BTCFor$280M #FranceAdvancesCryptoSelfCustodyReportingProposal
#CPIWatch #OptimismOPRises19.98%