View of METUSDT price structure and current validation zones
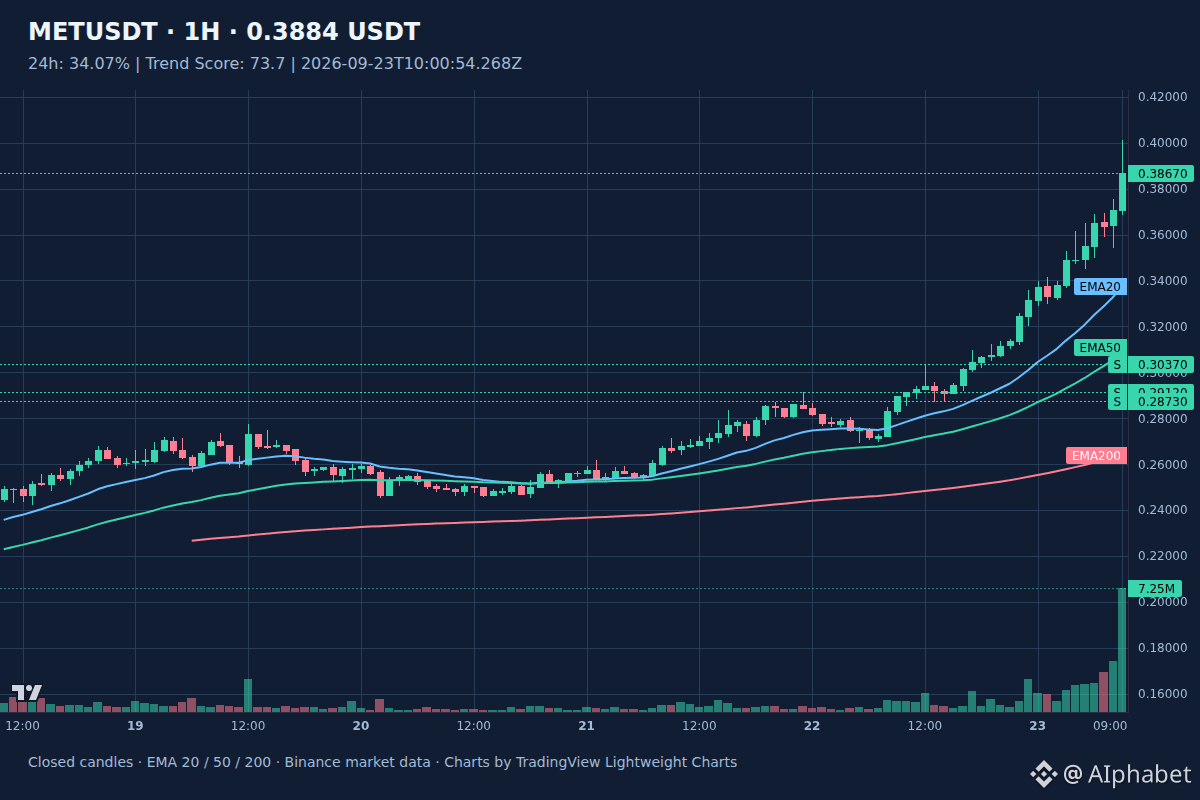
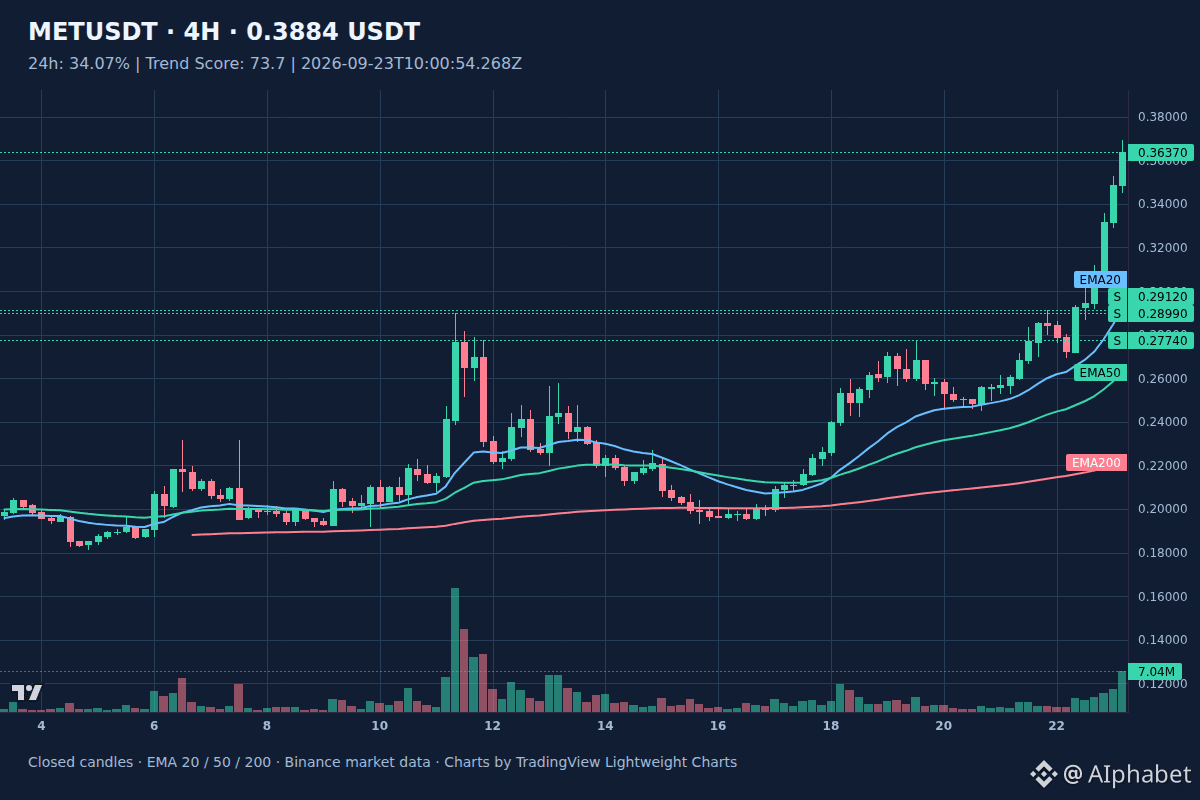
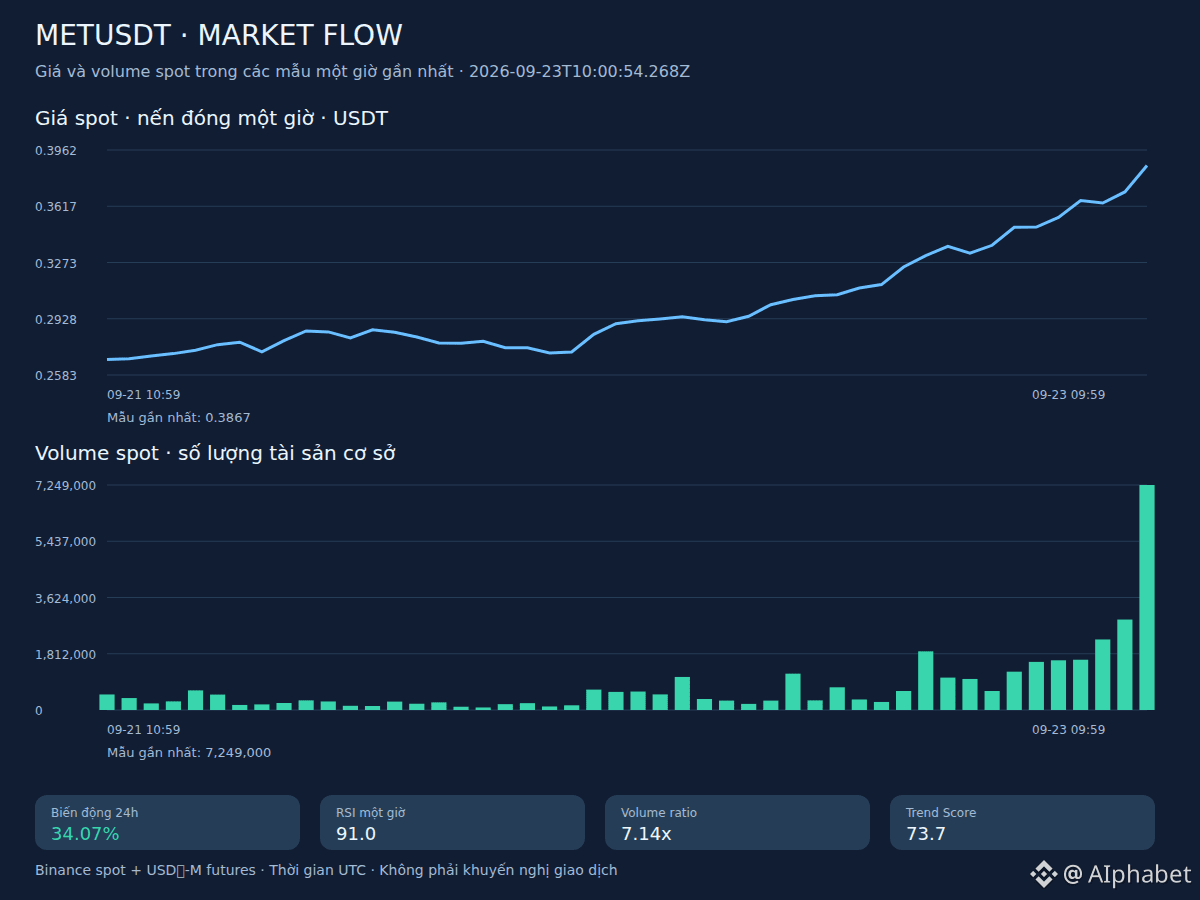
The market is focusing on the $MET k volatility cycle as the trading price reaches 0.3884 with an upward range of 34.07%.
Upside: Buyers continue to maintain pressure to push the price higher, holding above key moving average lines and forming a foundation toward higher targets.
Downside: Increased profit-taking pressure may pull the price back to retest lower support zones such as 0.3694, or deeper at 0.3037.
The chart shows a clear breakout phase with trading volume rising strongly across multiple timeframes, reflecting that capital flow is being concentrated significantly. However, technical indicators are in an overbought area, requiring caution before unexpected shakeouts. The high RSI levels indicate short-term correction risk when buying momentum temporarily stalls.
#METUSDT #BinanceSquare
The market is focusing on the $MET k volatility cycle as the trading price reaches 0.3884 with an upward range of 34.07%.
Upside: Buyers continue to maintain pressure to push the price higher, holding above key moving average lines and forming a foundation toward higher targets.
Downside: Increased profit-taking pressure may pull the price back to retest lower support zones such as 0.3694, or deeper at 0.3037.
The chart shows a clear breakout phase with trading volume rising strongly across multiple timeframes, reflecting that capital flow is being concentrated significantly. However, technical indicators are in an overbought area, requiring caution before unexpected shakeouts. The high RSI levels indicate short-term correction risk when buying momentum temporarily stalls.
#METUSDT #BinanceSquare