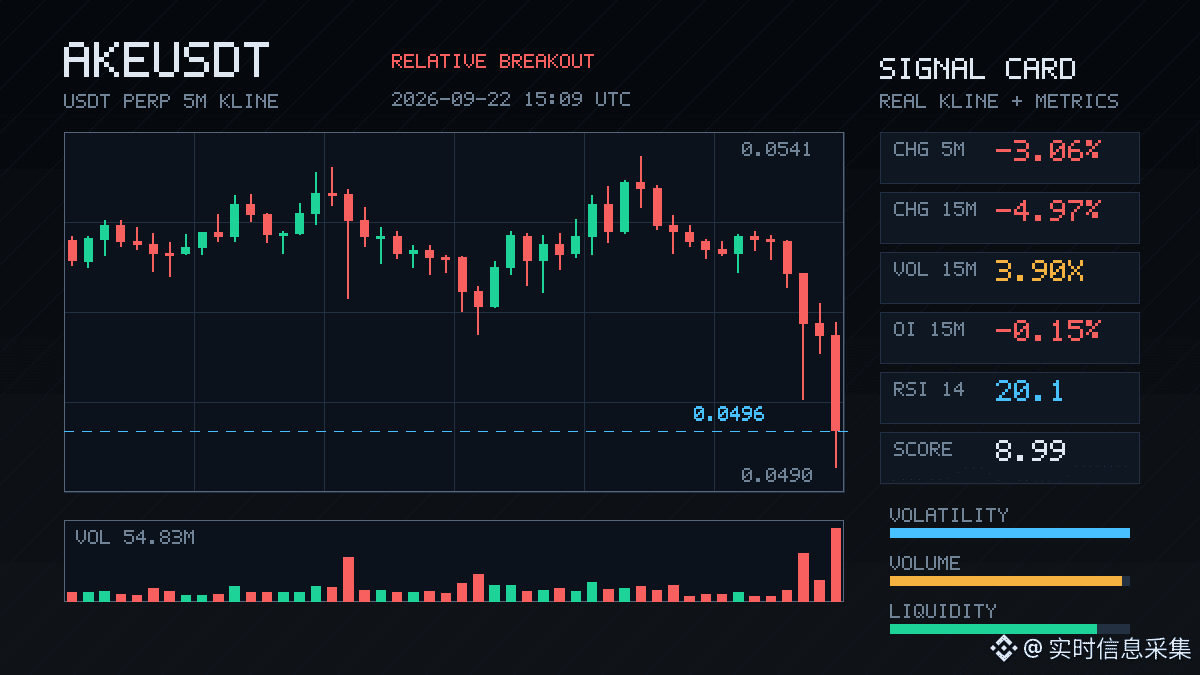
$AKE This drop is quite decisive—on the 15m chart it’s directly -4.97%. Volume is up to 3.9x, active trade imbalance is -16.1%, buy/sell ratio is 0.72, and the sell pressure is very solid. OI on both 15m and 1h is decreasing; nominal has shed 1.34M / 2.15M. The whole pool is ranked abnormally high at #15, and nominal change at #14—definitely one of the more eye-catching pools today.
Structurally, it looks more like longs deleveraging or stop-loss cascades, rather than new shorts pushing in aggressively. Price has just broken below the lower band of the last ~20 5m candles. For now, we’ll see whether it can reclaim this range. If it can’t, this kind of contraction-style selloff often comes with a second probe. In the past 24h, trading value is 383M. Liquidity is sufficient, and volatility isn’t small either—when chasing shorts or catching dips, you need to leave some room for error.
Structurally, it looks more like longs deleveraging or stop-loss cascades, rather than new shorts pushing in aggressively. Price has just broken below the lower band of the last ~20 5m candles. For now, we’ll see whether it can reclaim this range. If it can’t, this kind of contraction-style selloff often comes with a second probe. In the past 24h, trading value is 383M. Liquidity is sufficient, and volatility isn’t small either—when chasing shorts or catching dips, you need to leave some room for error.