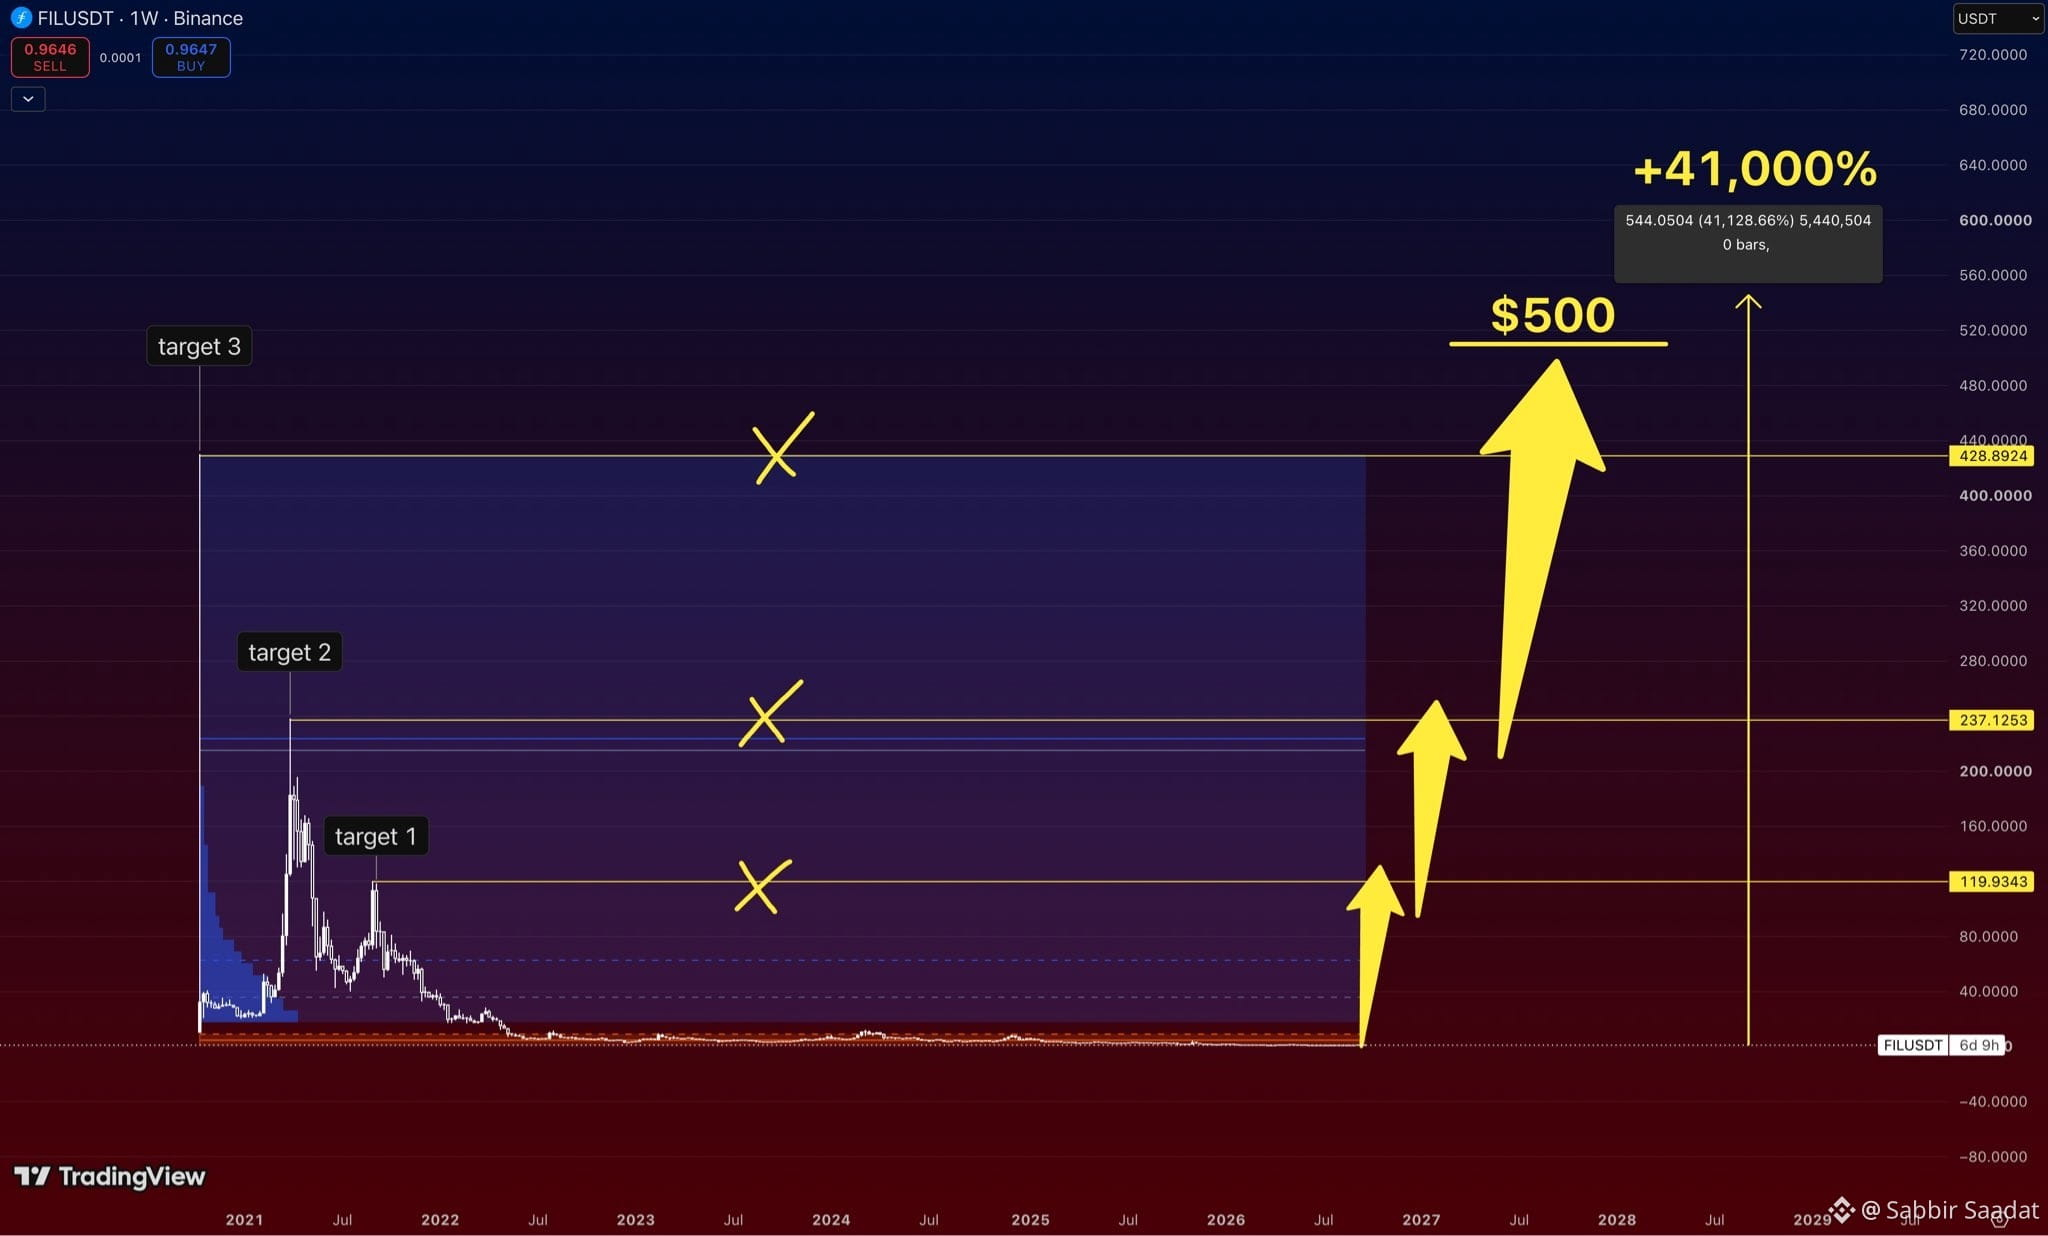

$FIL under $1 looks ridiculous when you zoom out.
Not because $500 is guaranteed.
Because this thing once traded near $200
spent years getting absolutely destroyed
and now sits almost flat at the bottom of the entire chart.
The levels I care about:
$119.93 → $237.12 → $428.89
And if the full move on this chart ever plays out
we’re talking roughly +41,000% toward the $500 area.
Sounds insane.
But crypto has a funny habit of making the insane target look obvious only after the move already happened.
Not because $500 is guaranteed.
Because this thing once traded near $200
spent years getting absolutely destroyed
and now sits almost flat at the bottom of the entire chart.
The levels I care about:
$119.93 → $237.12 → $428.89
And if the full move on this chart ever plays out
we’re talking roughly +41,000% toward the $500 area.
Sounds insane.
But crypto has a funny habit of making the insane target look obvious only after the move already happened.