

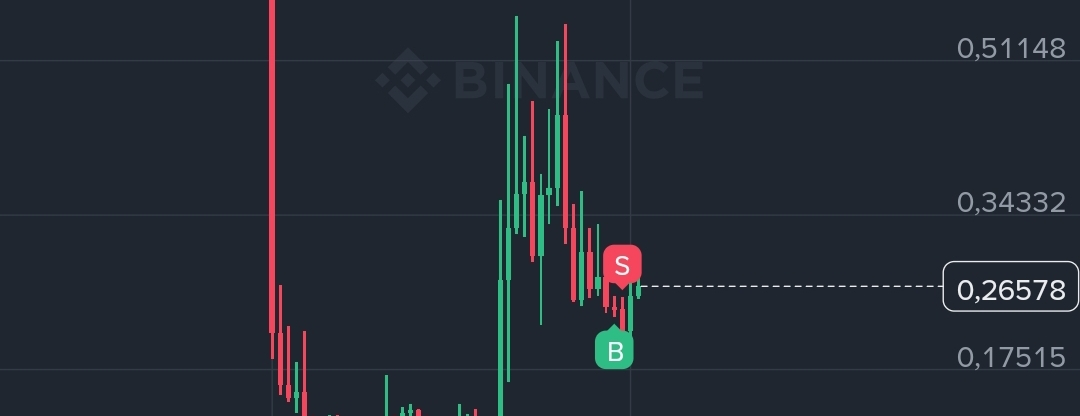
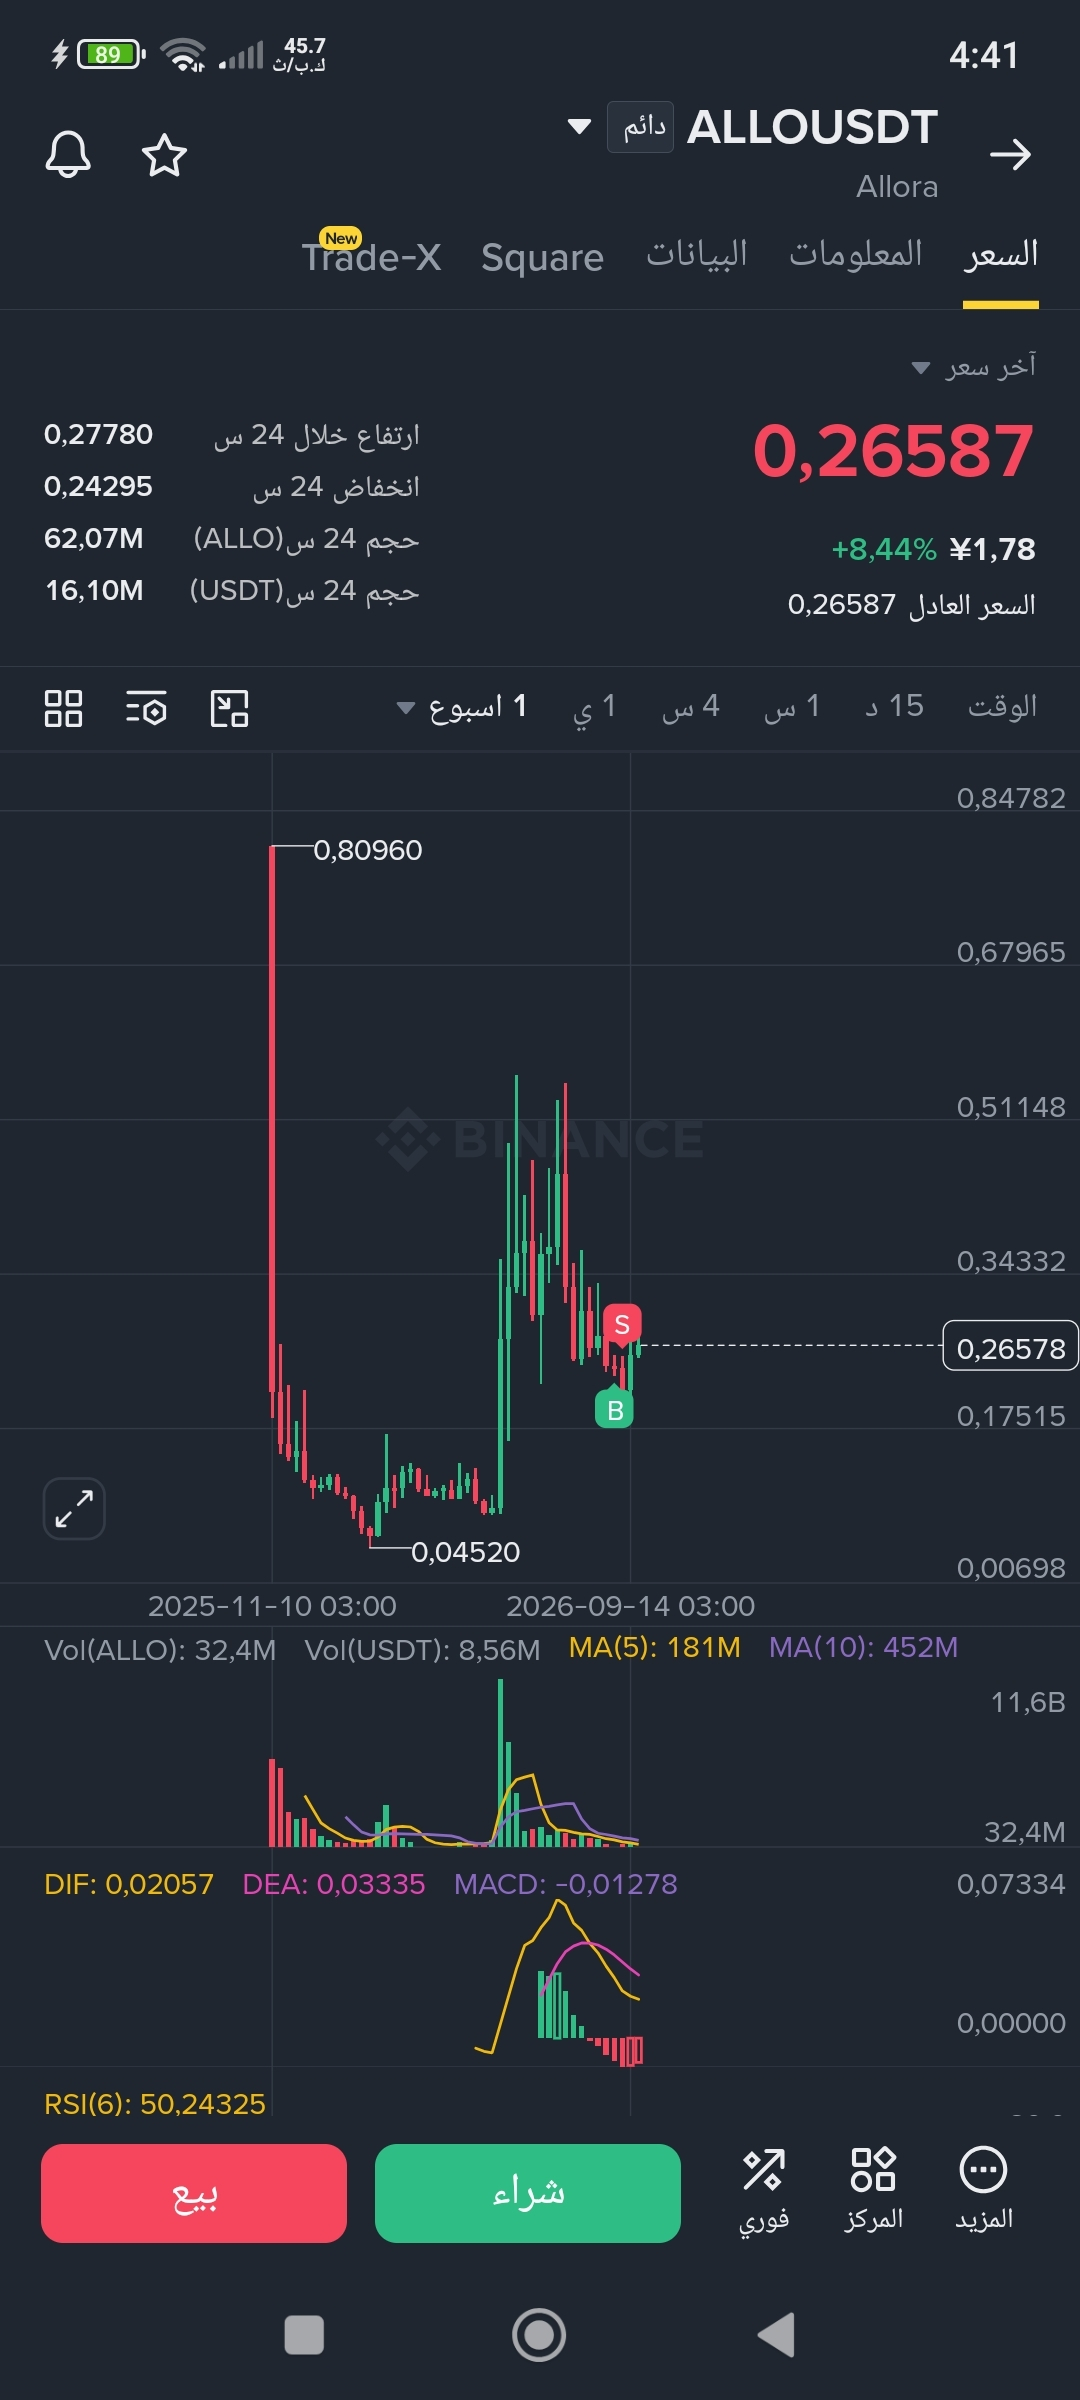
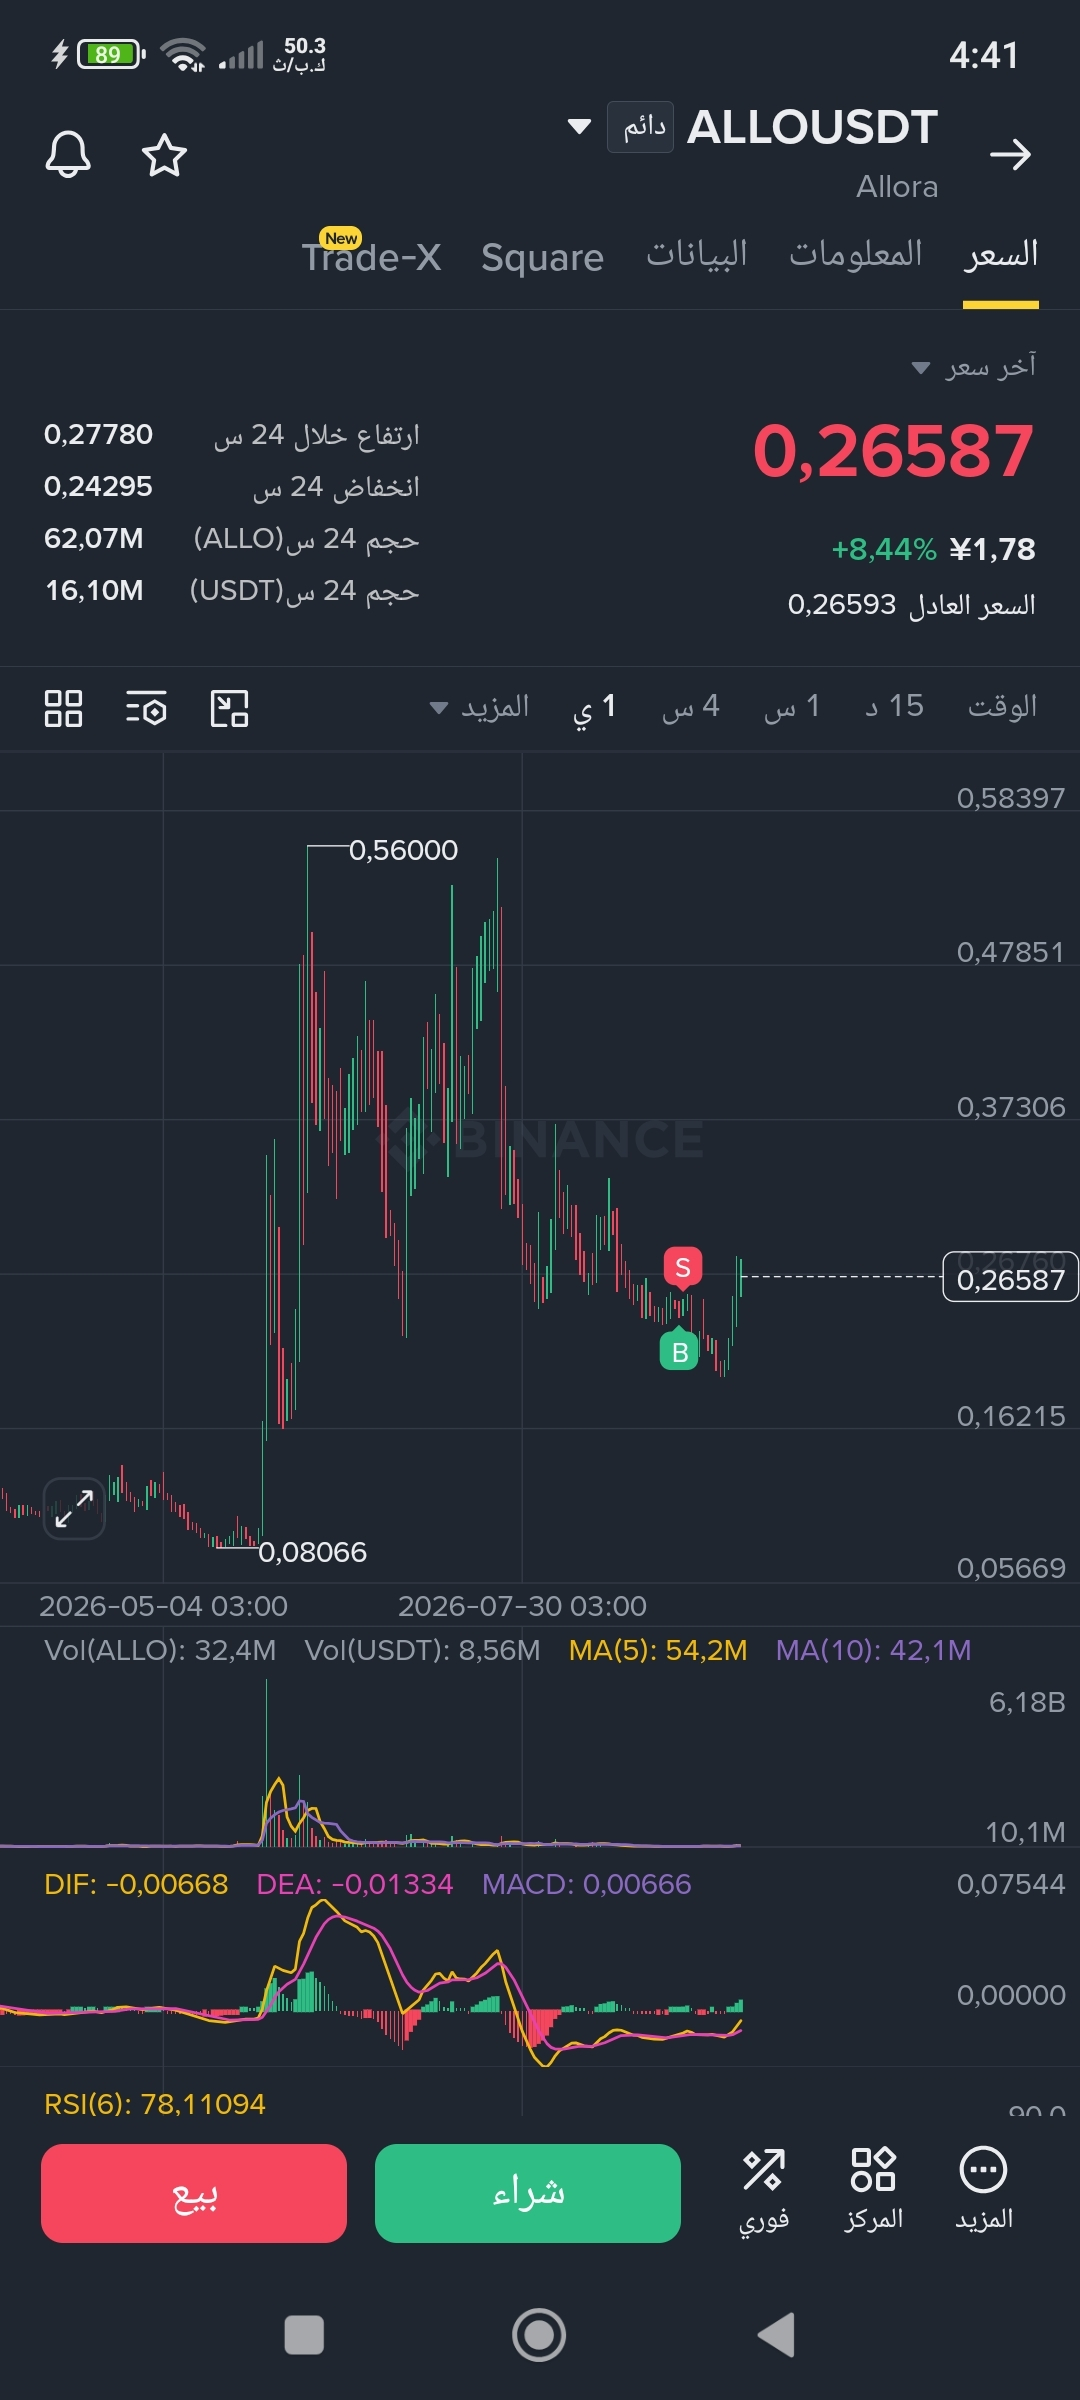
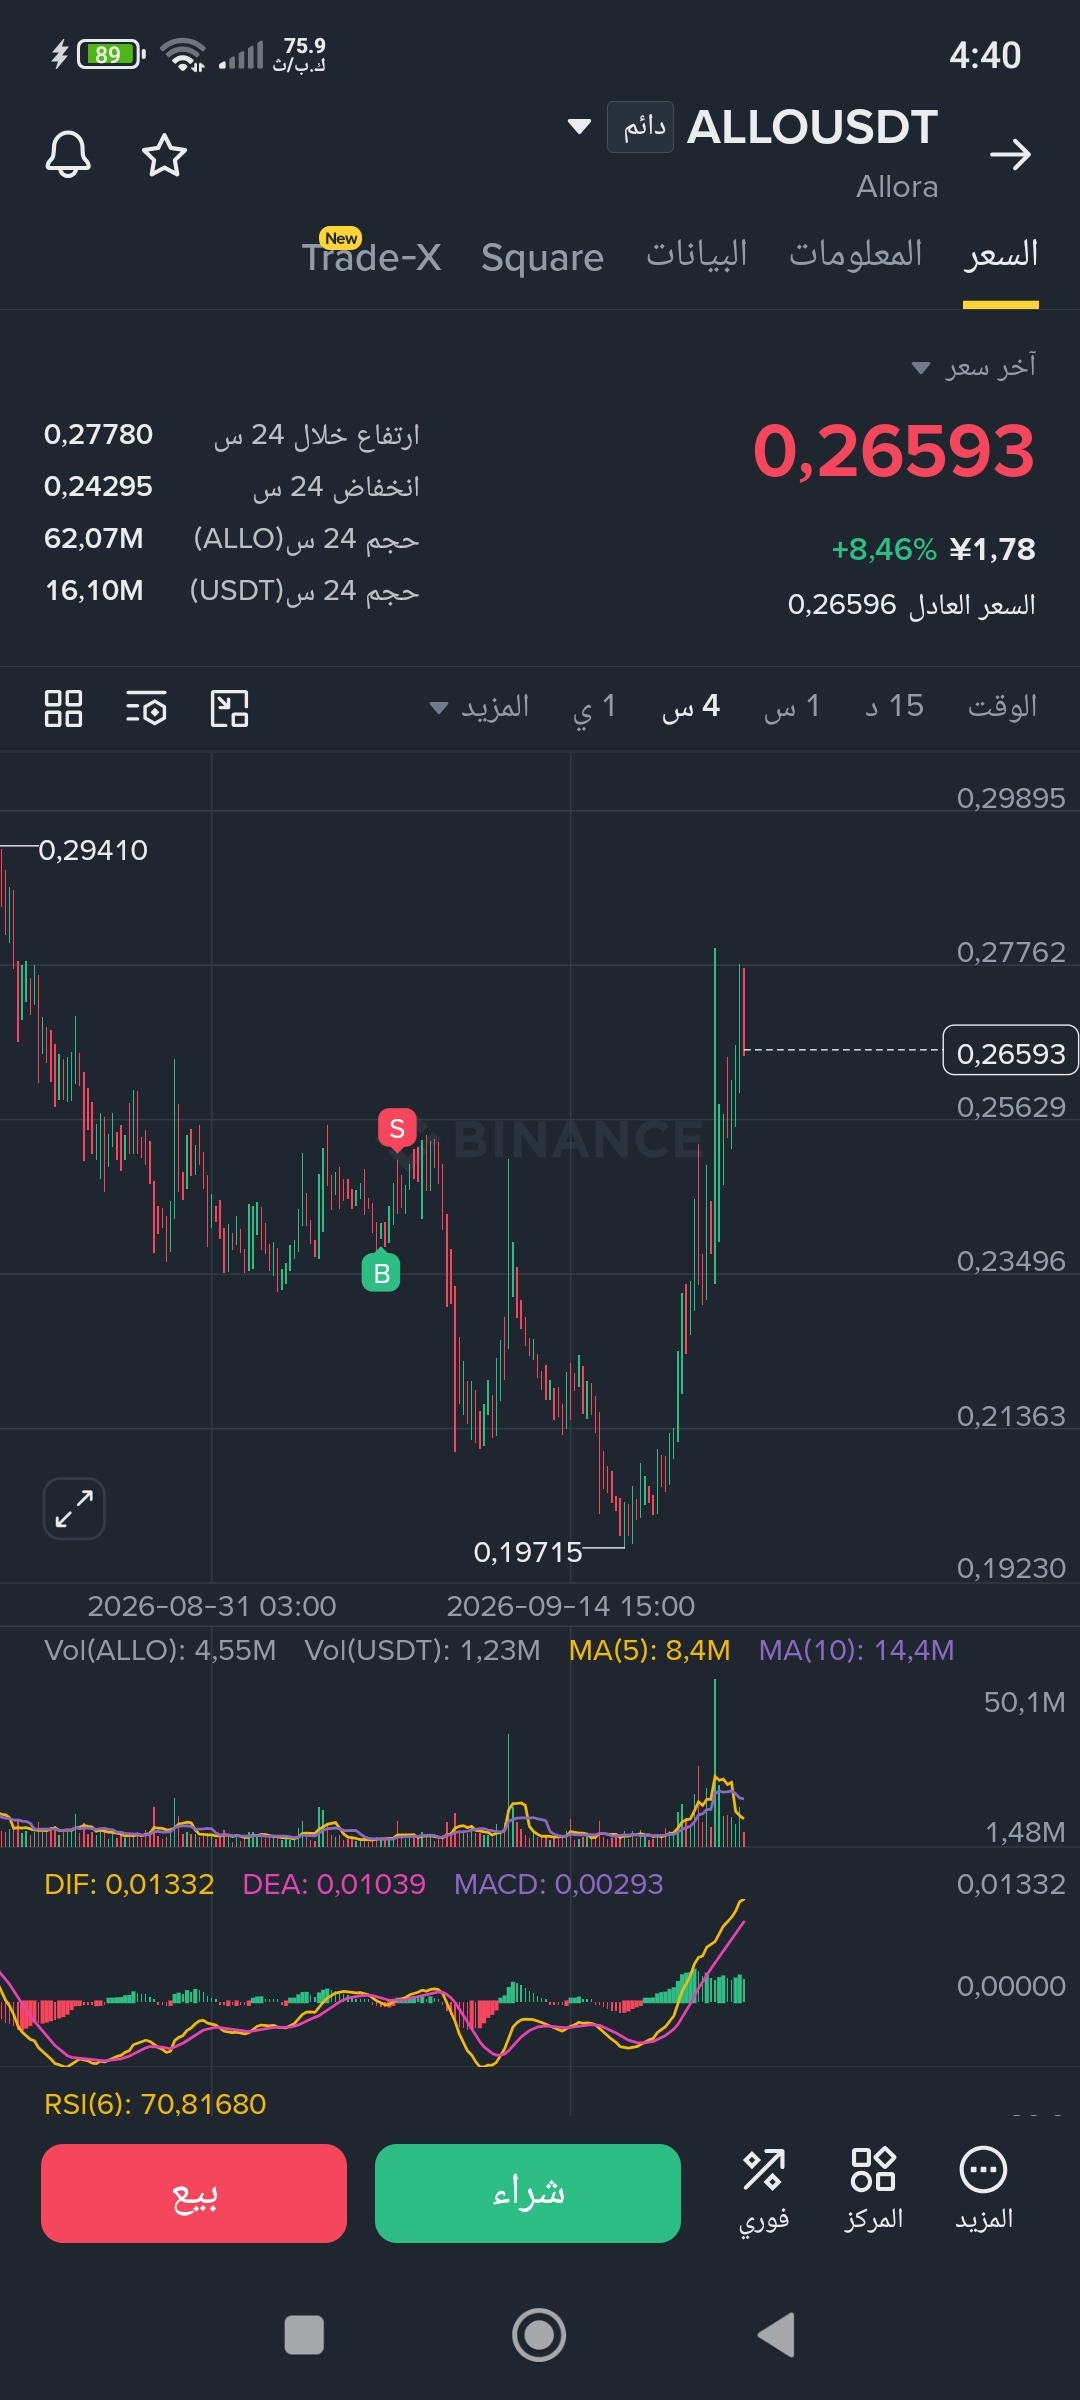
Yes. From the images, it’s possible to create a very good image for ALLO/USDT; because you sent the weekly + daily + 4-hour data along with the current price data. I will treat $0.2663 as the analysis price shown in the images.
🔥 Summary first
The current trend has clearly turned bullish on 4H and started improving on 1D, but the price is now close to a very important resistance at $0.2777.
So I don’t prefer chasing the price at 0.266–0.275; instead, I’m watching for one of two scenarios:
1. Correction toward support zones, then gradual entry.
2. Breakout of 0.2777 with a 4H close, then a successful retest.
📊 1 — 4-hour analysis
Price: 0.2663$
Averages:
EMA6 = 0.26140
EMA12 = 0.25259
EMA20 = 0.24376
This is a very positive point because:
EMA6 > EMA12 > EMA20
And the price is higher than all of them.
This means that short-/medium-term momentum has turned bullish.
Most importantly, the move from about 0.1974 → 0.2777 was very strong, so there is a chance of taking profits before the uptrend continues.
Most important current resistance
0.2777$
This is the visible top on 4H.
If it’s broken with a 4-hour close and good trading volume, the door opens for higher areas.
🟢 Entry zones that I’m watching
🥇 The first zone — entry on the correction
0.258 – 0.262$
This is the most important nearby area right now.
Because it’s consolidating:
The current price of the EMA6 is roughly
A potential retest area for the last move
Short-term support
If the price drops to it and a clear bounce candle appears + buying volume:
Potential entry: 0.258–0.262
🥈 The second zone — stronger entry
0.250 – 0.255$
These are the most important to me in terms of the risk/reward ratio.
It roughly corresponds to:
EMA12 on 4H = 0.2526
A mid-move retest area on the uptrend
If the price reaches it without breaking down the 4H structure, then this is an area worth strong attention.
🥉 The third zone — deeper correction
0.243 – 0.247$
And this is a very important area.
EMA20 on 4H is at:
0.24376
Therefore, holding this area means that the uptrend on the 4H is still relatively intact.
As for losing it with a clear 4H close, that would weaken the bullish scenario.
🚀 Breakout scenario
There is another way to enter.
Resistance:
0.2777$
I don’t recommend considering a mere touch of 0.2777 as a breakout.
What’s required:
A 4H close above 0.2777 + a clear increase in volume
Then watch for the retest.
A potential retest area:
0.274 – 0.278$
If this area becomes support after the breakout, that provides a stronger technical signal to continue the move.
🎯 Potential targets
In case of a 0.2777 breakout and staying above it:
Target Area
TP1 0.290–0.300$
TP2 0.315–0.330$
TP3 0.350–0.380$
TP4 0.42–0.45$
Far target 0.50$+
But I don’t treat it as guaranteed targets; every level needs confirmation and suitable volume movement.
📈 2 — Daily analysis
The daily is very important for this coin.
The visible historical top:
0.56473$
Then there was a long drop down to around 0.18$, and now we’re seeing a strong rebound.
What’s interesting is that:
EMA6 = 0.24008
EMA12 = 0.23340
EMA20 = 0.23570
Price = 0.2663
That means the price is above the daily averages.
This is a clear improvement in structure.
But…
There is a psychological and technical resistance at:
0.30$
And this is a very important area because the price has traded around it several times before.
If 0.30 is broken with consistency, the market can start retesting higher areas than the previous move.
📅 3 — Weekly
There is a point here that you should pay attention to.
Weekly averages:
EMA6 = 0.25775
EMA12 = 0.26506
EMA20 = 0.25543
And the price is:
0.2663
That means the price is currently:
✅ Above EMA6
✅ Above EMA20
⚠️ Just slightly above EMA12
This makes 0.255–0.266 a key area on the weekly timeframe.
If the price stays above it and manages to form bullish weekly candles, the picture becomes stronger.
🧭 The ALLO map that I will monitor
0.450 ───────── Strong resistance
↑
0.380 ───────── Possible target
↑
0.350 ───────── Resistance
↑
0.330 ───────── Target
0.315 ───────── Resistance
0.300 ───────── Strong psychological resistance
↑
0.278 ───────── 🔴 Current top / breakout
0.266 ───────── Current price
↓
0.262 ───────── First support
0.258 ───────── First support
0.252 ───────── 🟢 An important entry zone
0.244 ───────── 🟢 Critical 4H support
0.235 ───────── Daily support
0.220 ───────── Deeper support
0.197 ───────── Bottom of the last move
⭐ Best 3 zones to monitor
1️⃣ 0.258–0.262$
Entry on a mild correction.
2️⃣ 0.250–0.255$
A better area if there’s a deeper correction.
3️⃣ 0.274–0.280$
It’s not a random buy zone; I only watch it if there’s a confirmed breakout above 0.2777 and a retest.
⚠️ When does the scenario change?
Very bullish:
A 4H close above 0.2777 with high volume → watch 0.30, then 0.315–0.33.
Neutral:
Movement between 0.25 and 0.278 → accumulation/correction, and waiting for a break from either end.
Bearish:
A break of 0.243–0.244$ with a 4H close → be cautious, because that would mean losing EMA20 and the short-term uptrend structure.
And breaking 0.233–0.235 would be much weaker on the daily.
🧠 A very important point
The move from 0.1974 to 0.2777 is roughly +40.7% in a short time, so entering with full capital at 0.266$ carries the risk of chasing the move.
If I were monitoring the trade technically, I would focus more on:
0.258–0.262 → 0.250–0.255 → 0.243–0.247
Or I wait:
0.2777 breakout → 4H close → retest → continuation.
Most importantly, the trading volume during the breakout is what will give the move more credibility—especially since the chart data shows 24-hour volume of about 5.7M ALLO / 1.475M USDT, so it shouldn’t be assumed that any green candle will automatically continue.