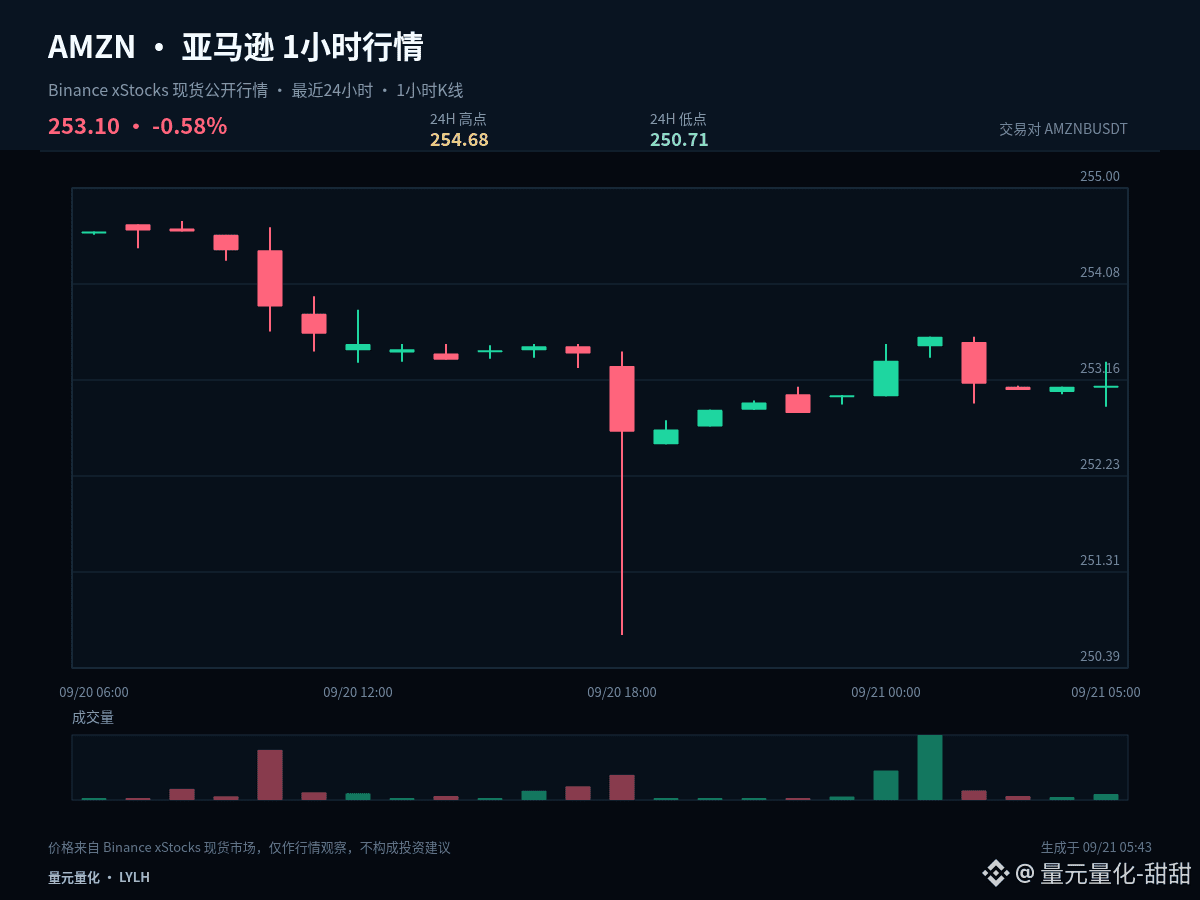
$AMZNB #AMZN Market Screen Record: current price 253.1, 1 hour +0.00%, 24 hours -0.58%, the amplitude in the past 24 hours is about 1.6%. First write down the data and judgments at this moment, then later use the trend to verify.
$AMZNB #AMZN is still repeatedly switching hands within the range of the past 24 hours, and there is no clear directional advantage. The middle position is the toughest test of patience; waiting for boundary signals is usually more effective.
I will take 252.695 as the short-term pivot between long and short. If it holds, it means the pullback is still within a controllable range; then, under suitable conditions, we may retest 254.68. After a valid breakdown, don’t rush to enter—wait for a new stable structure to form around 250.71.
My scenario planning is not a single bet on one direction. A break above 254.68 and the ability to hold it indicates that upside space has been reopened. A breakdown below 250.71 followed by an unsuccessful retest indicates the structure has weakened further. If price trades between the two, continue to observe the closing behavior on both sides of 252.695.
When reviewing, I will check three things: how price reacts when it first approaches the key level, whether the 1-hour close completes the confirmation, and whether the plan is adjusted as scheduled after the judgment becomes invalid. Compared with merely recording outcomes, these three items can reveal execution problems more effectively.
Risk control is still placed before the conclusion: only execute when conditions arise, reassess promptly when the price action invalidates the idea; the greater the volatility, the more restrained each position should be. The above is a market-screen projection based on the current 1-hour and 24-hour data and does not constitute any promise of returns.
#BTCBreaks80K
$AMZNB #AMZN is still repeatedly switching hands within the range of the past 24 hours, and there is no clear directional advantage. The middle position is the toughest test of patience; waiting for boundary signals is usually more effective.
I will take 252.695 as the short-term pivot between long and short. If it holds, it means the pullback is still within a controllable range; then, under suitable conditions, we may retest 254.68. After a valid breakdown, don’t rush to enter—wait for a new stable structure to form around 250.71.
My scenario planning is not a single bet on one direction. A break above 254.68 and the ability to hold it indicates that upside space has been reopened. A breakdown below 250.71 followed by an unsuccessful retest indicates the structure has weakened further. If price trades between the two, continue to observe the closing behavior on both sides of 252.695.
When reviewing, I will check three things: how price reacts when it first approaches the key level, whether the 1-hour close completes the confirmation, and whether the plan is adjusted as scheduled after the judgment becomes invalid. Compared with merely recording outcomes, these three items can reveal execution problems more effectively.
Risk control is still placed before the conclusion: only execute when conditions arise, reassess promptly when the price action invalidates the idea; the greater the volatility, the more restrained each position should be. The above is a market-screen projection based on the current 1-hour and 24-hour data and does not constitute any promise of returns.
#BTCBreaks80K