#ETH
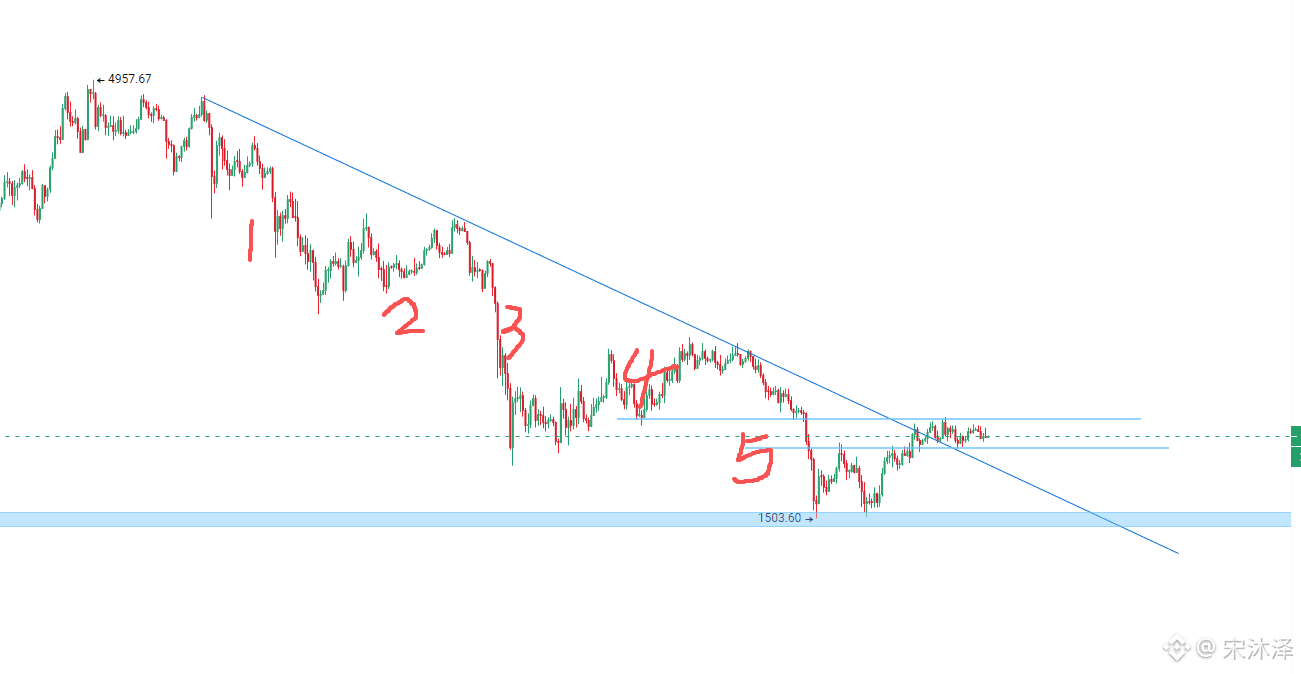
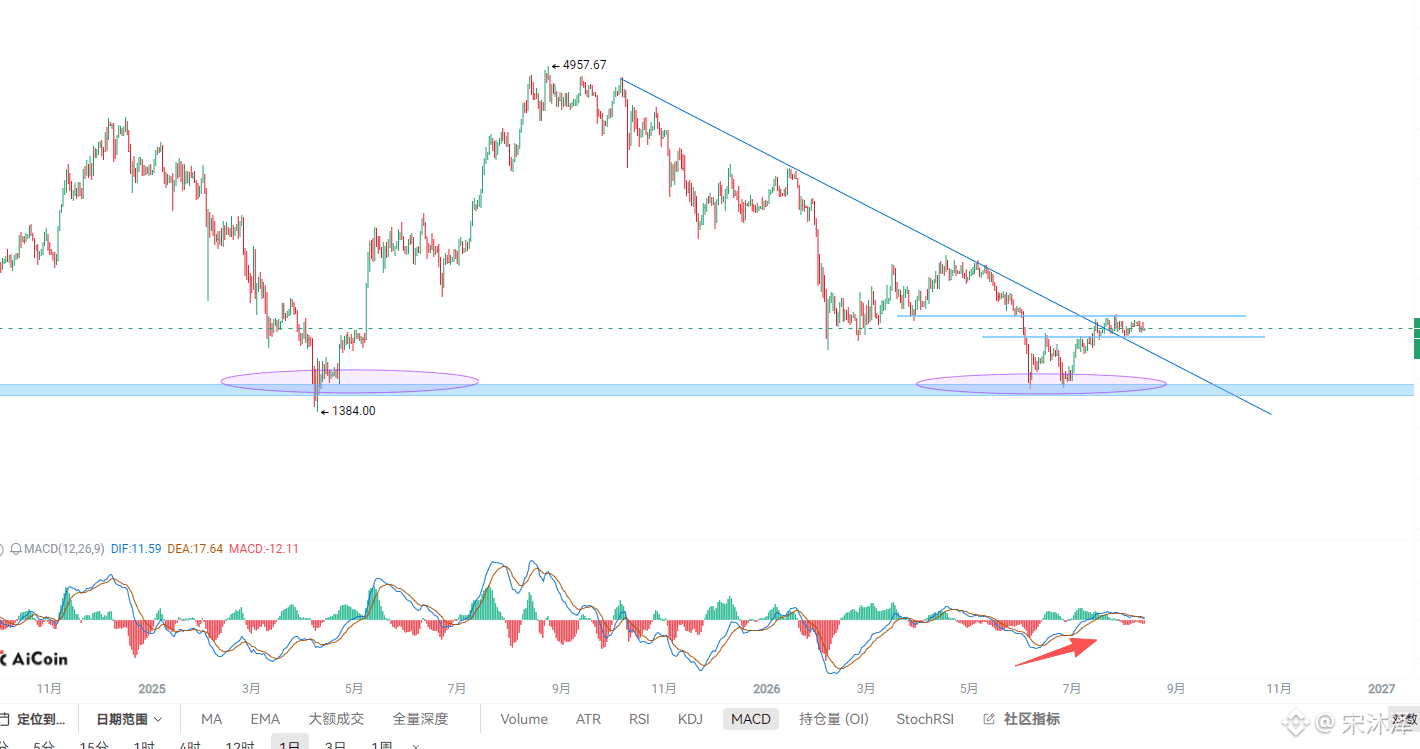
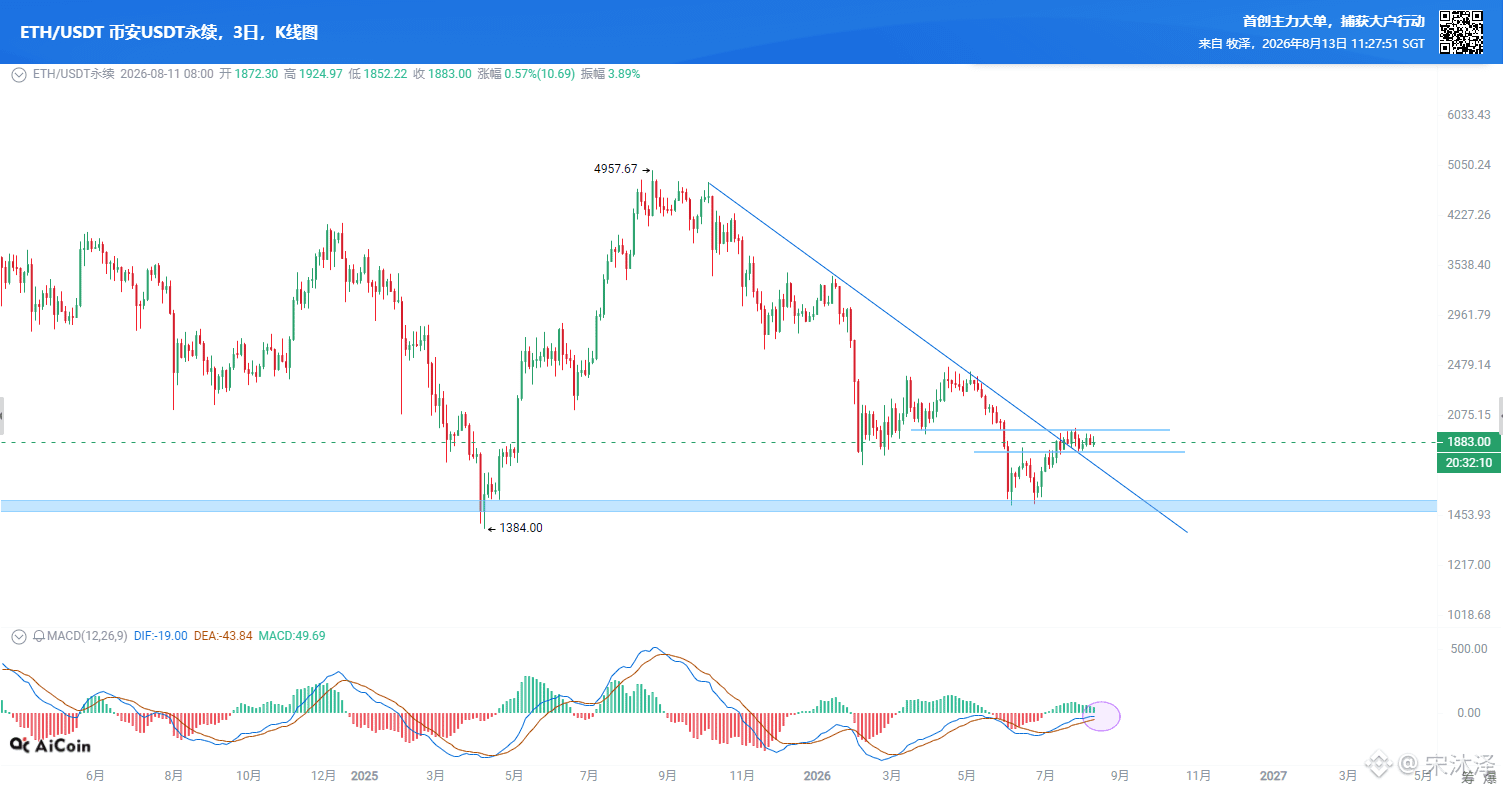
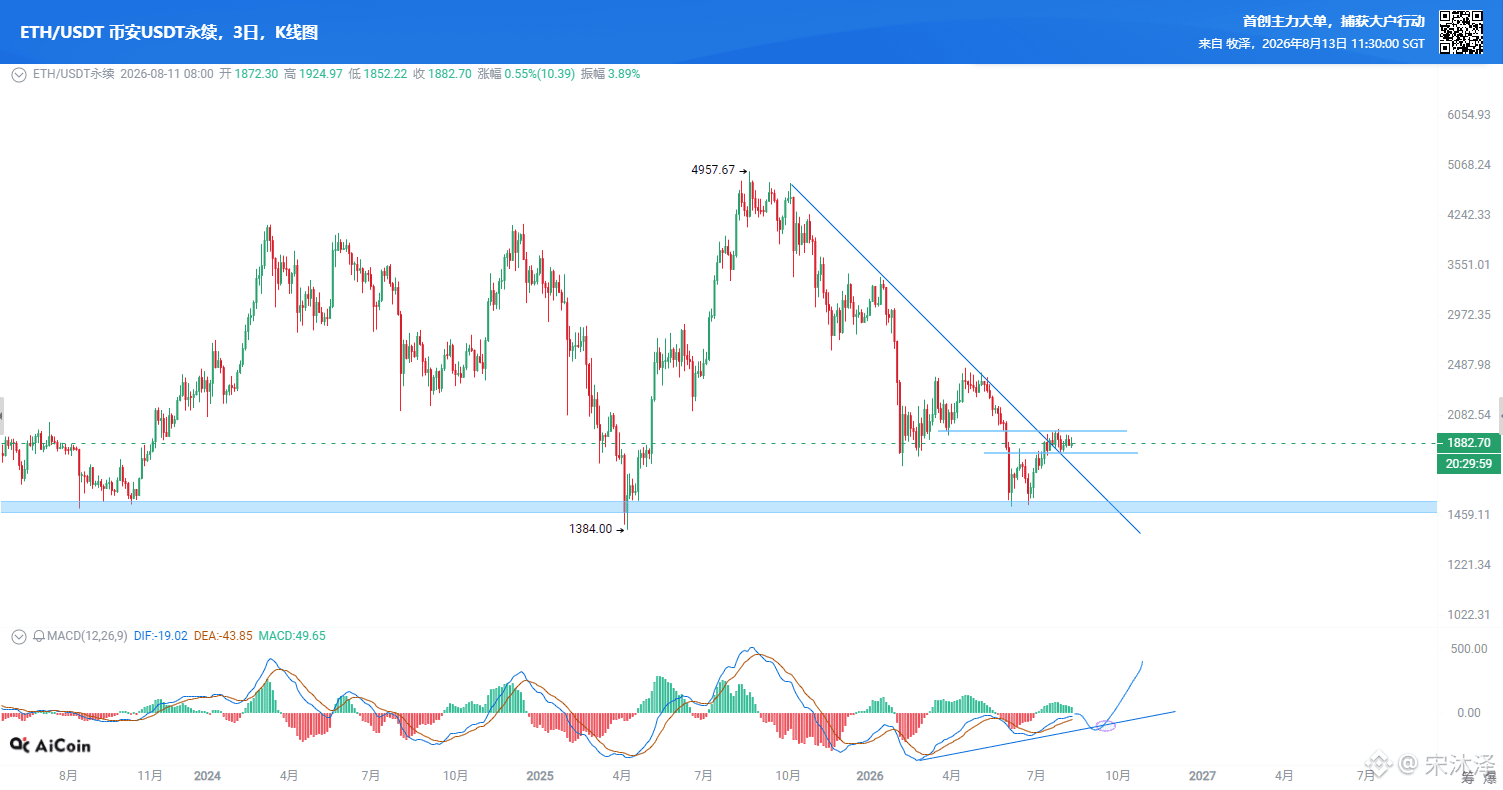
Ethereum daily chart shows a completed 5-wave sequence. The decline process should be over. After the prior low area provides support, a bullish divergence appears; then it breaks through the W neckline. Once it breaks the downtrend line, it should enter a period of mild consolidation and sideways range. At the current level, it is being suppressed by the 3-day line at the 0 axis. Watch the timing: after Ethereum breaks above the 0 axis, it may see a significant rally. Alternatively, if it dips below the 3-day line 0 axis and then forms consecutive bullish divergences, that would be an excellent buying opportunity. A divergence from the axis also needs to return to the 0 axis.
Ethereum daily chart shows a completed 5-wave sequence. The decline process should be over. After the prior low area provides support, a bullish divergence appears; then it breaks through the W neckline. Once it breaks the downtrend line, it should enter a period of mild consolidation and sideways range. At the current level, it is being suppressed by the 3-day line at the 0 axis. Watch the timing: after Ethereum breaks above the 0 axis, it may see a significant rally. Alternatively, if it dips below the 3-day line 0 axis and then forms consecutive bullish divergences, that would be an excellent buying opportunity. A divergence from the axis also needs to return to the 0 axis.