

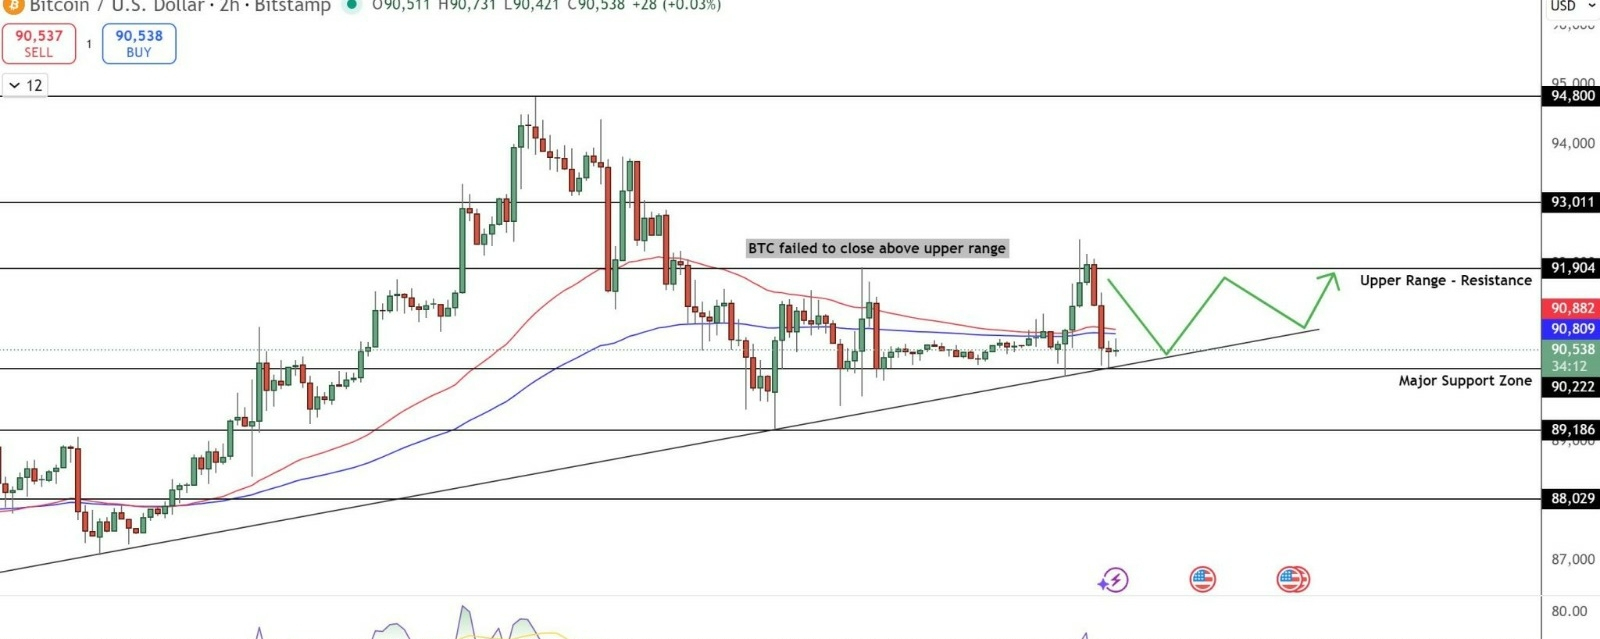

$BTC has spent the past week consolidating around the $62,800–$63,000 zone, sitting inside a descending channel while the 20-day moving average continues to act as resistance overhead.
📊 What to watch:
Support: $62,000 — a break below could open the door to further downside
Resistance: Upper trendline of the channel — a clean breakout here could shift sentiment bullish again
Macro trigger: The next FOMC decision lands September 16, and July's CPI print this month will likely set the tone until then
Zooming out, BTC is still up roughly 7% for July despite the recent pullback, and ETH has actually outperformed it over the same stretch. Spot ETF flows have been choppy too — a strong multi-day inflow streak just snapped into a $225M outflow amid renewed macro uncertainty.
The setup right now is classic range-bound tension: low volatility before a decisive move. Whether that move is up or down likely depends on how price reacts at either edge of the channel over the next few sessions.
Keep $BTC on your watchlist and track the chart closely — this is the kind of setup where the next candle can tell you a lot. 👇
What's your read — breakout above resistance, or a retest of $62K first?
#BTC #Bitcoin #CryptoAnalysis #Binance