
Decred (DCR) recorded a recovery rate of over 7% at the time of writing on Friday, after a series of three consecutive correction sessions that caused the price to lose nearly 14%. This increase is significantly supported by a trading volume surge of about 60% in the past 24 hours, reflecting a clear improvement in demand in the spot market. However, from a technical perspective, Decred still faces significant pressure from the resistance area around the $26 mark — a region that has repeatedly hindered the upward momentum since late November.
Decred continues to strive for a breakthrough at the key resistance area
According to data from CoinMarketCap, Decred's trading volume has reached 6,300,000 USD as of the current time on Friday, recording an impressive increase of 57% compared to 24 hours earlier. This development aligns with the recovery trend on Friday, also showing that market sentiment is clearly leaning towards the bulls.
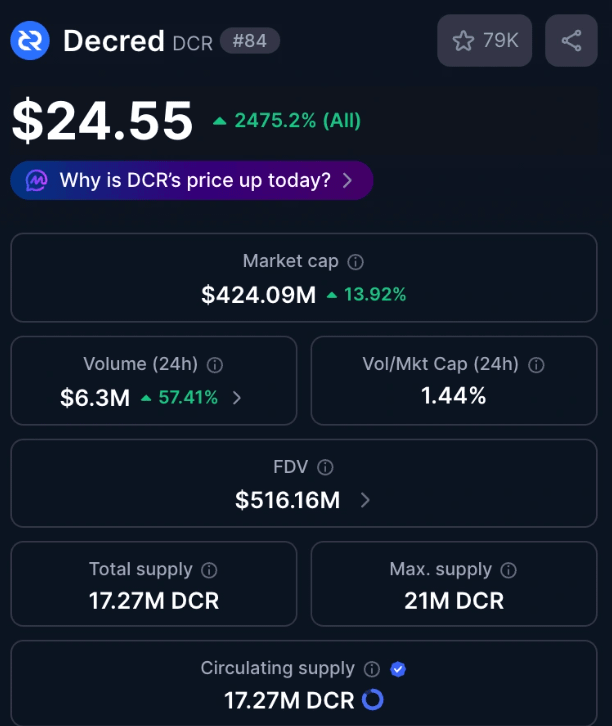 Decred market statistics | Source: CoinMarketCap
Technical outlook: Will Decred extend its increase past the important resistance?
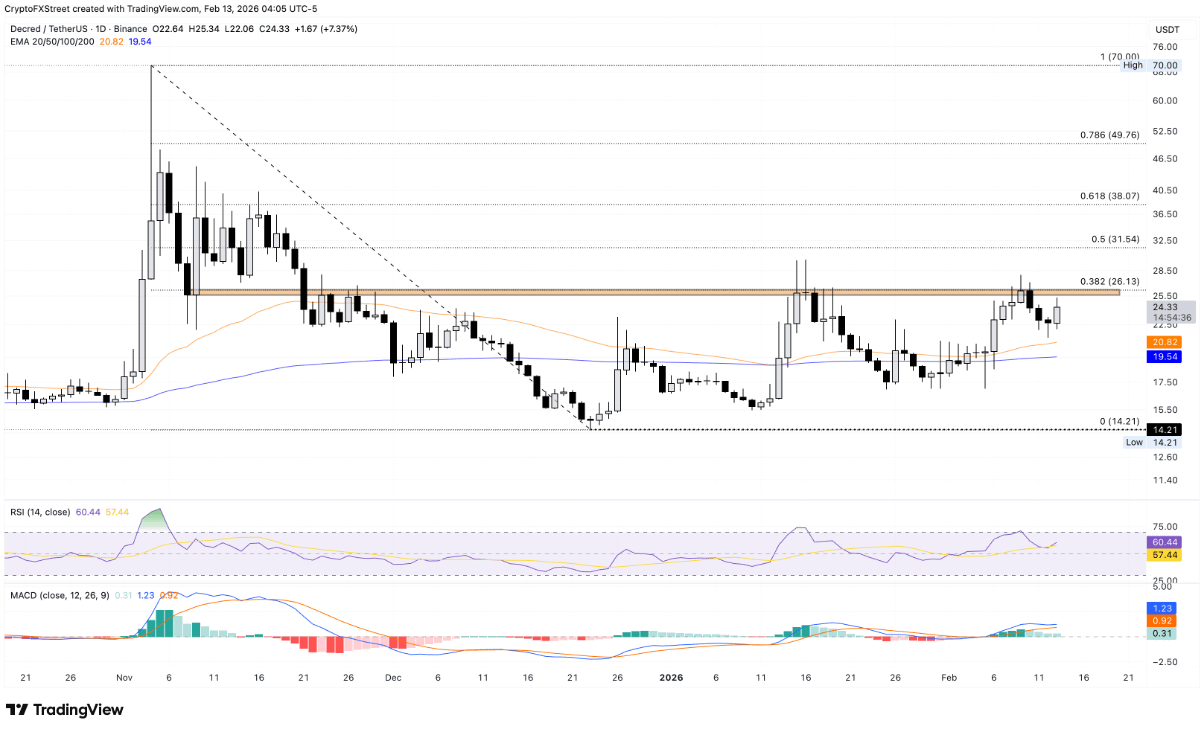
As of the time this article was written on Saturday, Decred is trading around the level above 24 USD, recording a rebound after three consecutive declining sessions with an increase of over 7%. Notably, this privacy-focused token still maintains its position above the two exponential moving averages (EMA) of 50 days and 200 days — a technical signal indicating that the uptrend is still prevailing.
However, Decred's recovery is facing significant obstacles at the resistance level around the Fibonacci retracement of 38.2% at 26.13 USD. This level is determined based on the decline from the peak of 70.00 USD on 4/11 to the bottom of 14.21 USD on 23/12. In a positive scenario, if the price can break out and close firmly above this resistance level on the daily timeframe, Decred is likely to aim for higher resistance levels at Fibonacci 50% and 61.8%, respectively at 31.54 USD and 38.07 USD.
 Daily DCR/USDT chart | Source: TradingView
The technical indicators on the daily chart are currently sending mixed signals, clearly reflecting the market's struggle around the key price level. The Relative Strength Index (RSI) at 60 indicates that the price has bounced above the neutral line, implying that short-term buying pressure is increasing and there is still room to continue rising before entering the overbought zone.
In contrast, the MACD indicator is trending sideways and faces the risk of crossing below the signal line — a sign that could open up the scenario of weakening again. Additionally, the blue histogram bars are gradually narrowing, indicating that the upward momentum is fading, increasing the likelihood that the price will enter a correction phase in the near future.
On the support side, the two EMA lines of 50 days and 200 days, located at 20.82 USD and 19.54 USD respectively, are expected to act as important buffer zones if selling pressure returns.
https://coinphoton.com/dcr-tang-toc-nho-dong-tien-lon-tien-sat-moc-khang-cu-then-chot.html