
#sui
sui
40.1M views
85,046 Discussing
Hot
Latest

·
--
Bullish
Is $SUI gearing up for a massive turnaround? 🌊🔥
Everyone's watching SUI at $0.72 right now, but a close look at the monthly (1M) and weekly (1W) charts shows we’re sitting on incredibly strong historical support! 📈⏳
Let’s break down the technical roadmap back to the top:
🛡️ Support to Watch: $0.6755. This is our major bottom right now. As long as SUI stays above this, the macro bullish structure is very much alive.
🚧 Major Hurdles:
➡️ $0.88 is our "Cost Price" resistance on the daily/weekly. A flip here triggers strong momentum.
➡️ $2.05 (MA 25) on the monthly and then $3.71 (prev week peak).
🚀 Ultimate Target: Reclaiming the ATH of $5.3687!
Getting back over $0.88-0.91 is the key to sparking the next major rally. Don't let the short-term noise distract you from the bigger picture.
Are you accumulating SUI under $1.00, or waiting for the breakouts? 💬👇
$BTC $ETH #SUI #SuiNetwork #TechnicalAnalysis #bullish #altcoins
{spot}(SUIUSDT)
Is $SUI gearing up for a massive turnaround? 🌊🔥
Everyone's watching SUI at $0.72 right now, but a close look at the monthly (1M) and weekly (1W) charts shows we’re sitting on incredibly strong historical support! 📈⏳
Let’s break down the technical roadmap back to the top:
🛡️ Support to Watch: $0.6755. This is our major bottom right now. As long as SUI stays above this, the macro bullish structure is very much alive.
🚧 Major Hurdles:
➡️ $0.88 is our "Cost Price" resistance on the daily/weekly. A flip here triggers strong momentum.
➡️ $2.05 (MA 25) on the monthly and then $3.71 (prev week peak).
🚀 Ultimate Target: Reclaiming the ATH of $5.3687!
Getting back over $0.88-0.91 is the key to sparking the next major rally. Don't let the short-term noise distract you from the bigger picture.
Are you accumulating SUI under $1.00, or waiting for the breakouts? 💬👇
$BTC $ETH #SUI #SuiNetwork #TechnicalAnalysis #bullish #altcoins
Everyone's watching SUI at $0.72 right now, but a close look at the monthly (1M) and weekly (1W) charts shows we’re sitting on incredibly strong historical support! 📈⏳
Let’s break down the technical roadmap back to the top:
🛡️ Support to Watch: $0.6755. This is our major bottom right now. As long as SUI stays above this, the macro bullish structure is very much alive.
🚧 Major Hurdles:
➡️ $0.88 is our "Cost Price" resistance on the daily/weekly. A flip here triggers strong momentum.
➡️ $2.05 (MA 25) on the monthly and then $3.71 (prev week peak).
🚀 Ultimate Target: Reclaiming the ATH of $5.3687!
Getting back over $0.88-0.91 is the key to sparking the next major rally. Don't let the short-term noise distract you from the bigger picture.
Are you accumulating SUI under $1.00, or waiting for the breakouts? 💬👇
$BTC $ETH #SUI #SuiNetwork #TechnicalAnalysis #bullish #altcoins
3
351

🚨 $SUI HOLDERS, DON'T LOSE HOPE!
The market can fall, but smart investors keep watching for opportunities. I believe $SUI deserves attention in the next market recovery.
Could SUI surprise the market with a massive rally? 🚀
My question: Are you accumulating $SUI or waiting for lower prices?
#SUI #Crypto #Altcoins
{future}(SUIUSDT)
🚨 $SUI HOLDERS, DON'T LOSE HOPE!
The market can fall, but smart investors keep watching for opportunities. I believe $SUI deserves attention in the next market recovery.
Could SUI surprise the market with a massive rally? 🚀
My question: Are you accumulating $SUI or waiting for lower prices?
#SUI #Crypto #Altcoins
The market can fall, but smart investors keep watching for opportunities. I believe $SUI deserves attention in the next market recovery.
Could SUI surprise the market with a massive rally? 🚀
My question: Are you accumulating $SUI or waiting for lower prices?
#SUI #Crypto #Altcoins
2
264

·
--
Bullish
💧 SUI ($SUI ) MOMENTUM WATCH: LAYER-1 LIQUIDITY FLOWING IN! 📈
High-throughput Layer-1 networks are capturing serious trader attention right now, and Sui ($SUI) continues to stand out with strong ecosystem activity and rising on-chain volume. As capital rotates into fast, scalable blockchains, $SUI is testing key upper resistance zones. ⚡
Breakout phases bring exciting upside, but discipline remains your #1 rule. Avoid chasing overextended candles with high leverage—stick to your entry plan and protect your capital! 🛡️💡
Do you think $SUI is ready for a new leg up this week? Share your chart levels below! 👇💬
#SUI #BinanceSquare #Layer1 #CryptoTrading #Web3
{spot}(SUIUSDT)
💧 SUI ($SUI ) MOMENTUM WATCH: LAYER-1 LIQUIDITY FLOWING IN! 📈
High-throughput Layer-1 networks are capturing serious trader attention right now, and Sui ($SUI ) continues to stand out with strong ecosystem activity and rising on-chain volume. As capital rotates into fast, scalable blockchains, $SUI is testing key upper resistance zones. ⚡
Breakout phases bring exciting upside, but discipline remains your #1 rule. Avoid chasing overextended candles with high leverage—stick to your entry plan and protect your capital! 🛡️💡
Do you think $SUI is ready for a new leg up this week? Share your chart levels below! 👇💬
#SUI #BinanceSquare #Layer1 #CryptoTrading #Web3
High-throughput Layer-1 networks are capturing serious trader attention right now, and Sui ($SUI ) continues to stand out with strong ecosystem activity and rising on-chain volume. As capital rotates into fast, scalable blockchains, $SUI is testing key upper resistance zones. ⚡
Breakout phases bring exciting upside, but discipline remains your #1 rule. Avoid chasing overextended candles with high leverage—stick to your entry plan and protect your capital! 🛡️💡
Do you think $SUI is ready for a new leg up this week? Share your chart levels below! 👇💬
#SUI #BinanceSquare #Layer1 #CryptoTrading #Web3

1
402

·
--

Article
🚀 $SUI Ecosystem Boom: $500M+ Bitcoin Finance Hub, Samsung Wallet & 40M TPS!$SUI is quietly rolling out some of the biggest institutional and real-world infrastructure upgrades in the crypto space right now!
Here is a quick breakdown of the major milestones putting $SUI in the spotlight:
• 🟠 $500M+ Bitcoin Finance Hub (Hashi): Sui’s new Bitcoin finance infrastructure launched with over $500 Million in committed capital, backed by Anchorage Digital for institutional custody and settlement.
• 📱 Samsung Wallet Integration: A planned rollout aims to bring USDC on Sui directly to 82 Million U.S. Samsung Galaxy devices—a massive step toward mainstream mobile adoption.
• ⚡ 40.6M TPS Speed Milestone: During a controlled stress test at Basecamp, Sui recorded an astonishing 40.6 million transactions per second.
• 🌎 Latin America Expansion: Brazil’s Mercado Bitcoin added support for $SUI , USDC, and usdSUI, with plans for tokenized assets ahead.
💡 My Take:
Connecting $BTC liquidity, institutional custody, and 82 million Samsung devices shows $SUI is focusing heavily on real-world utility rather than just hype. If adoption follows this infrastructure, long-term fundamentals look very strong!
👇 Which $SUI catalyst excites you the most—the $500M Bitcoin hub or the 82M Samsung Wallet integration? Share your thoughts in the comments! 💬🔥
#SUI #SuiNetwork #Bitcoin #BTC
{spot}(SUIUSDT)
{spot}(BTCUSDT)
🚀 $SUI Ecosystem Boom: $500M+ Bitcoin Finance Hub, Samsung Wallet & 40M TPS!
$SUI is quietly rolling out some of the biggest institutional and real-world infrastructure upgrades in the crypto space right now!
Here is a quick breakdown of the major milestones putting $SUI in the spotlight:
• 🟠 $500M+ Bitcoin Finance Hub (Hashi): Sui’s new Bitcoin finance infrastructure launched with over $500 Million in committed capital, backed by Anchorage Digital for institutional custody and settlement.
• 📱 Samsung Wallet Integration: A planned rollout aims to bring USDC on Sui directly to 82 Million U.S. Samsung Galaxy devices—a massive step toward mainstream mobile adoption.
• ⚡ 40.6M TPS Speed Milestone: During a controlled stress test at Basecamp, Sui recorded an astonishing 40.6 million transactions per second.
• 🌎 Latin America Expansion: Brazil’s Mercado Bitcoin added support for $SUI , USDC, and usdSUI, with plans for tokenized assets ahead.
💡 My Take:
Connecting $BTC liquidity, institutional custody, and 82 million Samsung devices shows $SUI is focusing heavily on real-world utility rather than just hype. If adoption follows this infrastructure, long-term fundamentals look very strong!
👇 Which $SUI catalyst excites you the most—the $500M Bitcoin hub or the 82M Samsung Wallet integration? Share your thoughts in the comments! 💬🔥
#SUI #SuiNetwork #Bitcoin #BTC
Here is a quick breakdown of the major milestones putting $SUI in the spotlight:
• 🟠 $500M+ Bitcoin Finance Hub (Hashi): Sui’s new Bitcoin finance infrastructure launched with over $500 Million in committed capital, backed by Anchorage Digital for institutional custody and settlement.
• 📱 Samsung Wallet Integration: A planned rollout aims to bring USDC on Sui directly to 82 Million U.S. Samsung Galaxy devices—a massive step toward mainstream mobile adoption.
• ⚡ 40.6M TPS Speed Milestone: During a controlled stress test at Basecamp, Sui recorded an astonishing 40.6 million transactions per second.
• 🌎 Latin America Expansion: Brazil’s Mercado Bitcoin added support for $SUI , USDC, and usdSUI, with plans for tokenized assets ahead.
💡 My Take:
Connecting $BTC liquidity, institutional custody, and 82 million Samsung devices shows $SUI is focusing heavily on real-world utility rather than just hype. If adoption follows this infrastructure, long-term fundamentals look very strong!
👇 Which $SUI catalyst excites you the most—the $500M Bitcoin hub or the 82M Samsung Wallet integration? Share your thoughts in the comments! 💬🔥
#SUI #SuiNetwork #Bitcoin #BTC
1
346

·
--
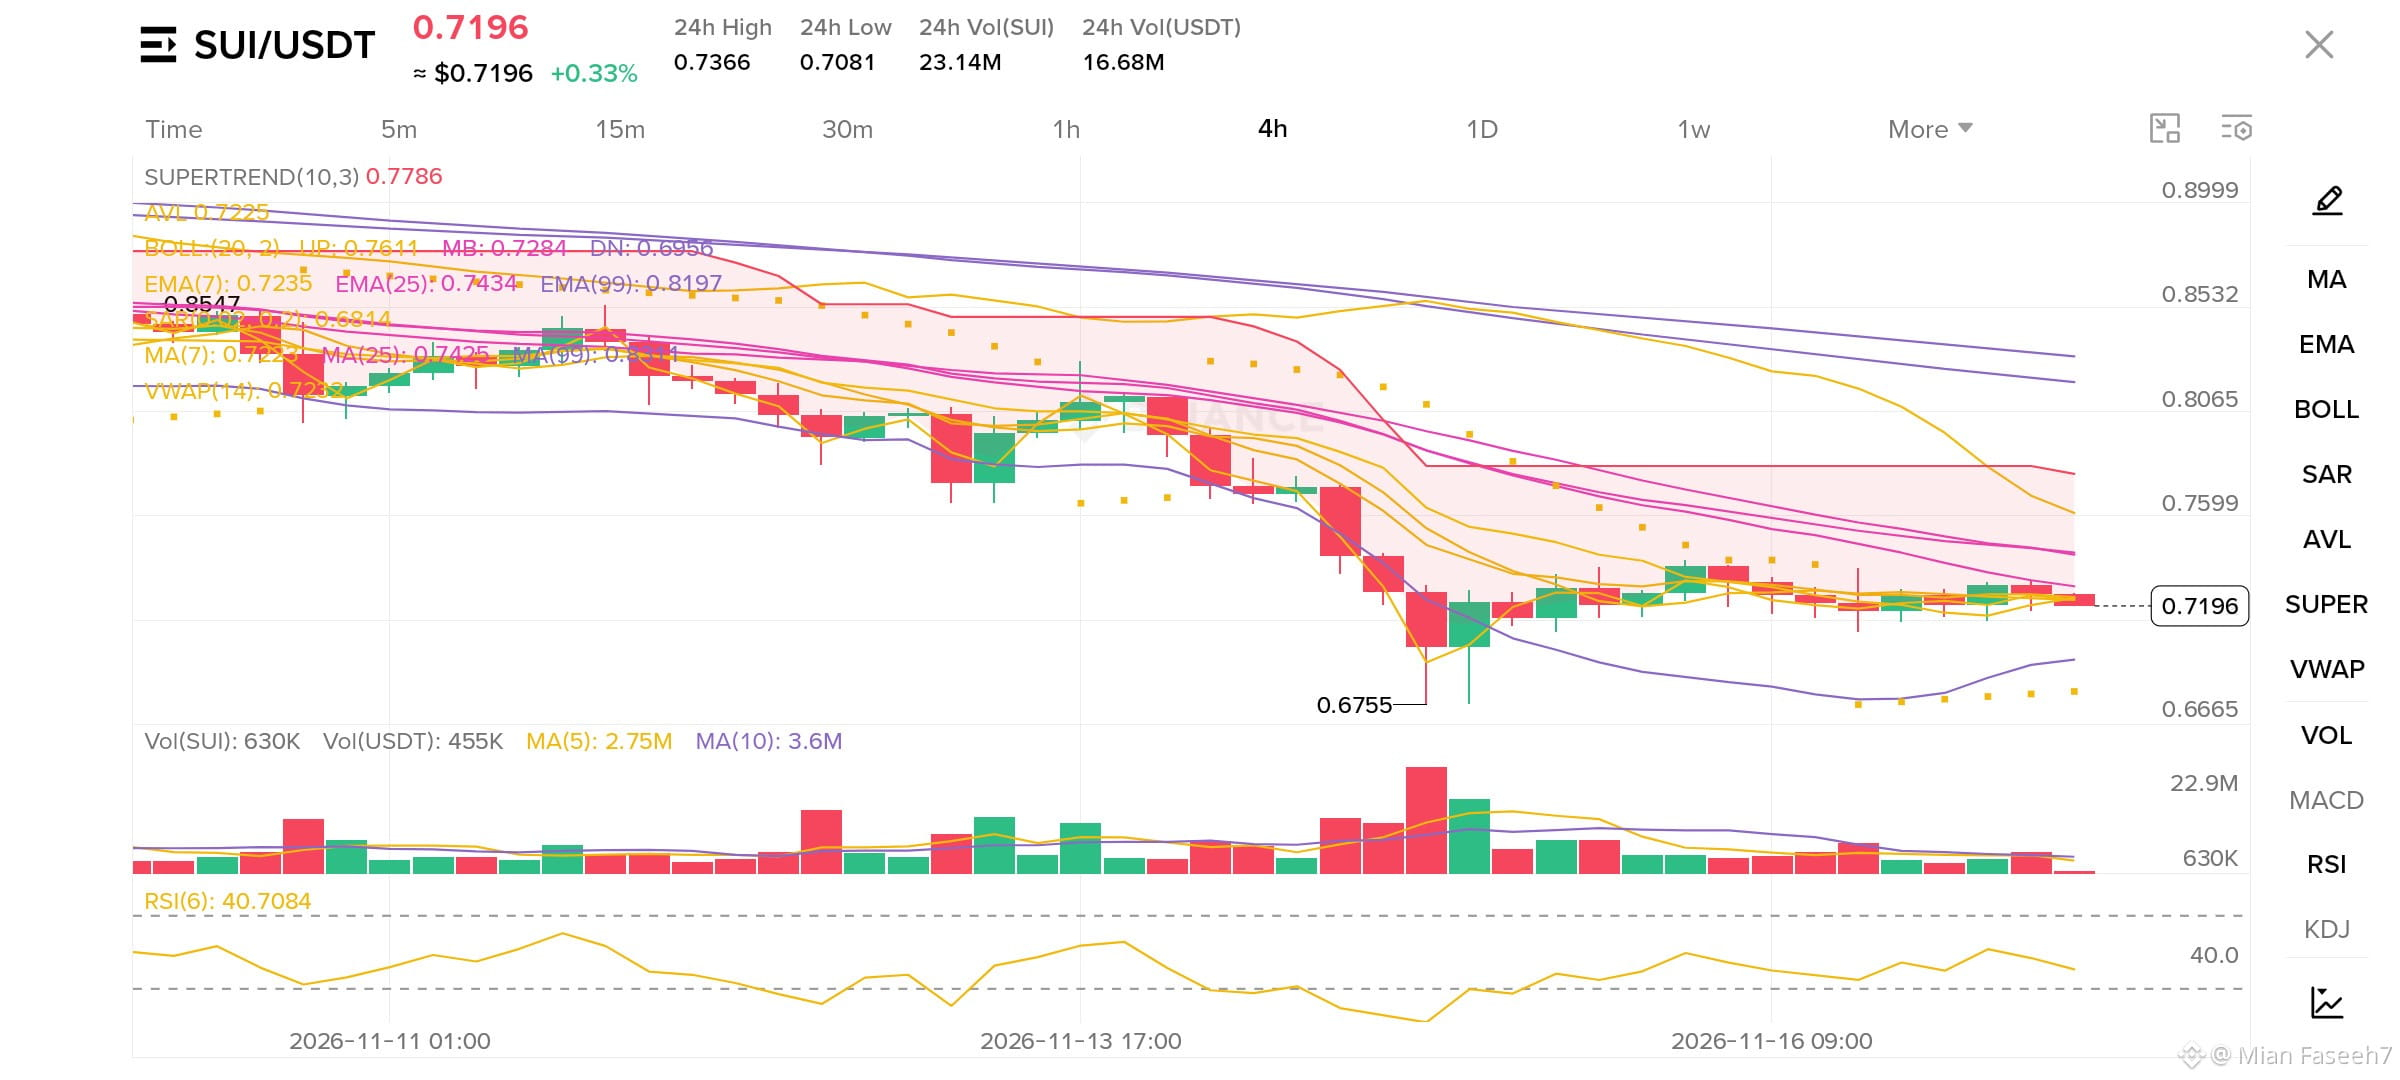
$SUI is trading at $0.7196 after dropping from $0.7366 high. Sellers pushed it down but buyers are trying to hold $0.7081 low.
Right now $SUI is still below Supertrend $0.7786, so $0.7786 is the main resistance. RSI is at 40.70, which means SUI is in neutral zone, buyers need to step in for a bounce.
If $SUI holds above $0.7081, the next target is $0.7366 and then $0.7786. If it breaks below $0.7081, then we can see $0.6755 again.
I am still holding SUI here, not panicking on this dip. What about you guys? Are you buying this dip or waiting for a lower price?
Follow for daily SUI updates and simple analysis.
{spot}(SUIUSDT)
If this analysis helped you, a small Tip is appreciated 🙏
#SUI #SuiNetwork #Crypto #BinanceSquare
$SUI is trading at $0.7196 after dropping from $0.7366 high. Sellers pushed it down but buyers are trying to hold $0.7081 low.
Right now $SUI is still below Supertrend $0.7786, so $0.7786 is the main resistance. RSI is at 40.70, which means SUI is in neutral zone, buyers need to step in for a bounce.
If $SUI holds above $0.7081, the next target is $0.7366 and then $0.7786. If it breaks below $0.7081, then we can see $0.6755 again.
I am still holding SUI here, not panicking on this dip. What about you guys? Are you buying this dip or waiting for a lower price?
Follow for daily SUI updates and simple analysis.
If this analysis helped you, a small Tip is appreciated 🙏
#SUI #SuiNetwork #Crypto #BinanceSquare
Right now $SUI is still below Supertrend $0.7786, so $0.7786 is the main resistance. RSI is at 40.70, which means SUI is in neutral zone, buyers need to step in for a bounce.
If $SUI holds above $0.7081, the next target is $0.7366 and then $0.7786. If it breaks below $0.7081, then we can see $0.6755 again.
I am still holding SUI here, not panicking on this dip. What about you guys? Are you buying this dip or waiting for a lower price?
Follow for daily SUI updates and simple analysis.
If this analysis helped you, a small Tip is appreciated 🙏
#SUI #SuiNetwork #Crypto #BinanceSquare
334

·
--
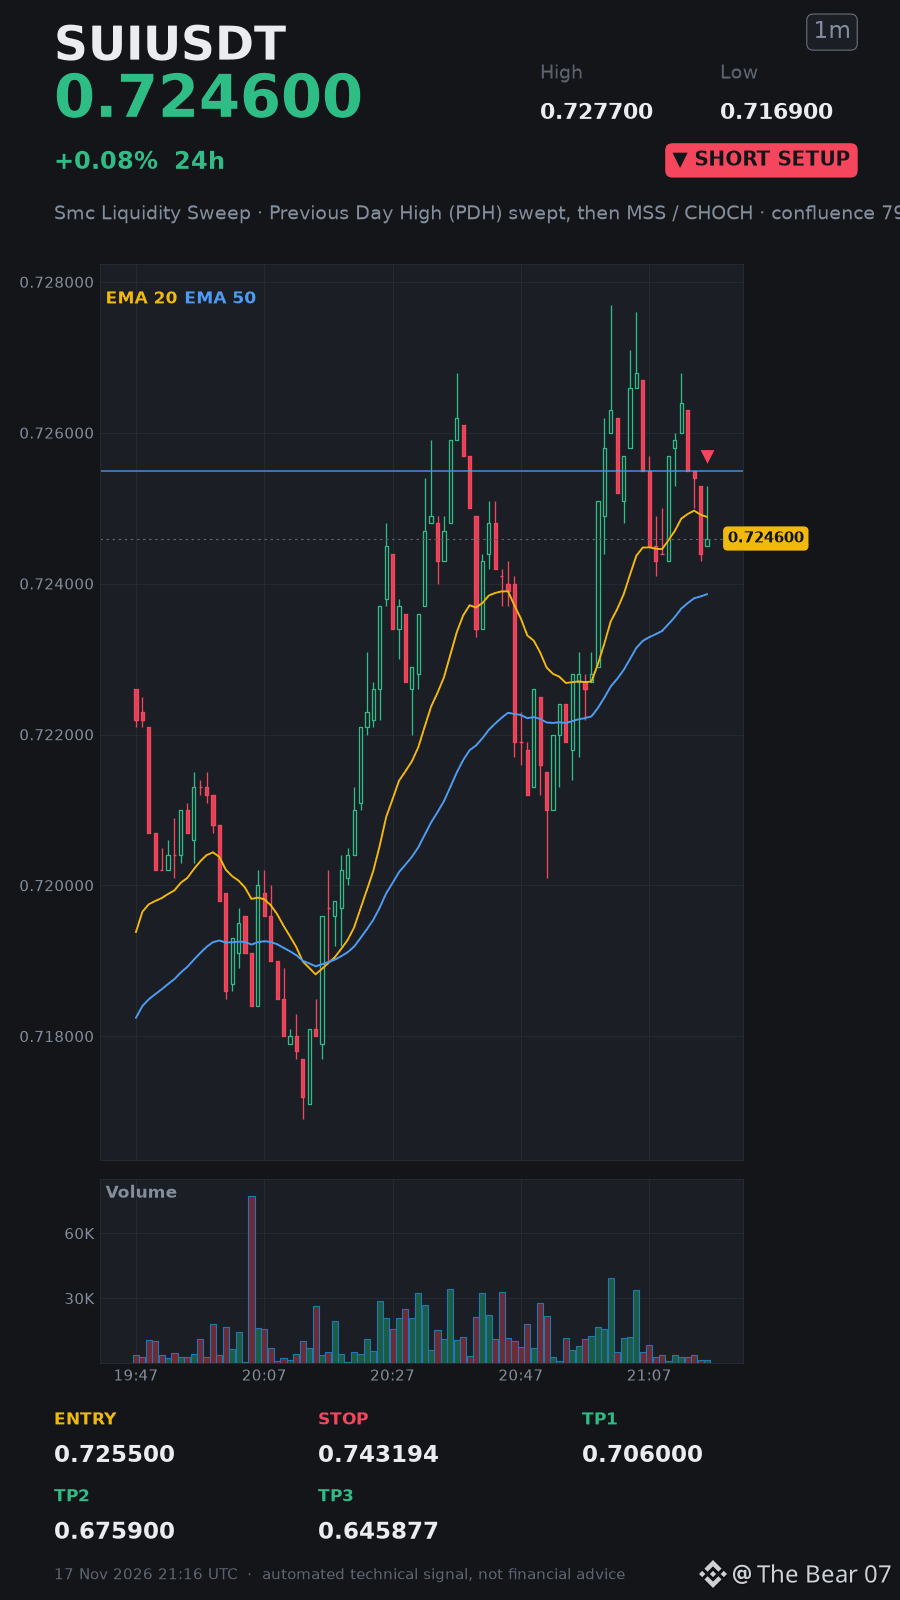
🚨 #SUI Liquidity Sweep Sparks Sharp Drop! 🤯🔻
I'm shorting hard right now. $SUI 👇
Short..... Quick..... Watch the swing..... Boom.....‼️‼️‼️
Entry: 0.7255 – 0.726
Stop-loss: 0.7432
🟢 TP1: 0.706
🟢 TP2: 0.6759
🟢 TP3: 0.6459
Join me, trade the dip together! 👇⬇️⬇️ Short.. With meee...👇⬇️ $SUI
🚨 #SUI Liquidity Sweep Sparks Sharp Drop! 🤯🔻
I'm shorting hard right now. $SUI 👇
Short..... Quick..... Watch the swing..... Boom.....‼️‼️‼️
Entry: 0.7255 – 0.726
Stop-loss: 0.7432
🟢 TP1: 0.706
🟢 TP2: 0.6759
🟢 TP3: 0.6459
Join me, trade the dip together! 👇⬇️⬇️ Short.. With meee...👇⬇️ $SUI
I'm shorting hard right now. $SUI 👇
Short..... Quick..... Watch the swing..... Boom.....‼️‼️‼️
Entry: 0.7255 – 0.726
Stop-loss: 0.7432
🟢 TP1: 0.706
🟢 TP2: 0.6759
🟢 TP3: 0.6459
Join me, trade the dip together! 👇⬇️⬇️ Short.. With meee...👇⬇️ $SUI

·
--
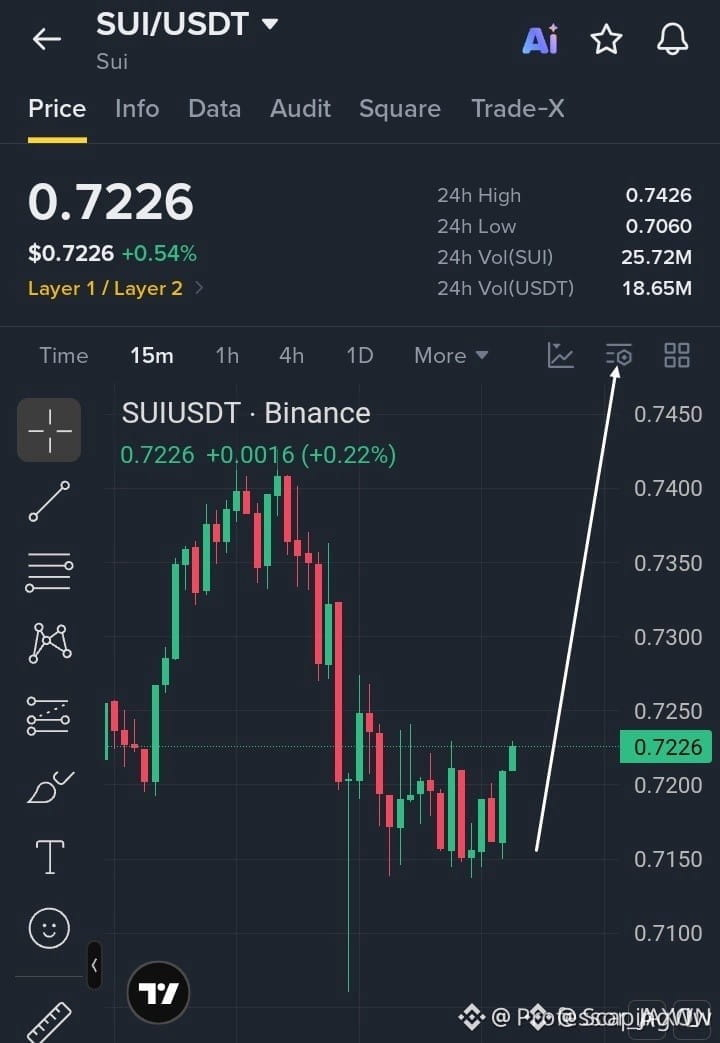
🚀 $SUI IS TIGHTENING THE COIL RIGHT BELOW MAJOR RESISTANCE! ⚡
Entry: $0.7210 – $0.7230 ⚡
Target: $0.7260, $0.7300, $0.7350 🚀
Stop Loss: $0.7140 ⚠️
Buyers are quietly absorbing every dip near $0.7150, building a rock-solid foundation for a clean momentum expansion. 📊 Order flow shows aggressive accumulation as disciplined bids step in to front-run the heavy overhead resistance ceiling sitting right at $0.7250.
Once this stubborn barrier finally cracks under expanding volume, expect a rapid liquidity sweep toward our higher upside targets. 💡 Are you positioning ahead of the breakout or waiting for confirmation above resistance? 👇
⚠️ Not financial advice. Always manage your risk. 🛡️
🏷️ #SUI #Breakout #LongSetup #Crypto
🔥 💎
🚀 $SUI IS TIGHTENING THE COIL RIGHT BELOW MAJOR RESISTANCE! ⚡
Entry: $0.7210 – $0.7230 ⚡
Target: $0.7260, $0.7300, $0.7350 🚀
Stop Loss: $0.7140 ⚠️
Buyers are quietly absorbing every dip near $0.7150, building a rock-solid foundation for a clean momentum expansion. 📊 Order flow shows aggressive accumulation as disciplined bids step in to front-run the heavy overhead resistance ceiling sitting right at $0.7250.
Once this stubborn barrier finally cracks under expanding volume, expect a rapid liquidity sweep toward our higher upside targets. 💡 Are you positioning ahead of the breakout or waiting for confirmation above resistance? 👇
⚠️ Not financial advice. Always manage your risk. 🛡️
🏷️ #SUI #Breakout #LongSetup #Crypto
🔥 💎
Entry: $0.7210 – $0.7230 ⚡
Target: $0.7260, $0.7300, $0.7350 🚀
Stop Loss: $0.7140 ⚠️
Buyers are quietly absorbing every dip near $0.7150, building a rock-solid foundation for a clean momentum expansion. 📊 Order flow shows aggressive accumulation as disciplined bids step in to front-run the heavy overhead resistance ceiling sitting right at $0.7250.
Once this stubborn barrier finally cracks under expanding volume, expect a rapid liquidity sweep toward our higher upside targets. 💡 Are you positioning ahead of the breakout or waiting for confirmation above resistance? 👇
⚠️ Not financial advice. Always manage your risk. 🛡️
🏷️ #SUI #Breakout #LongSetup #Crypto
🔥 💎
5

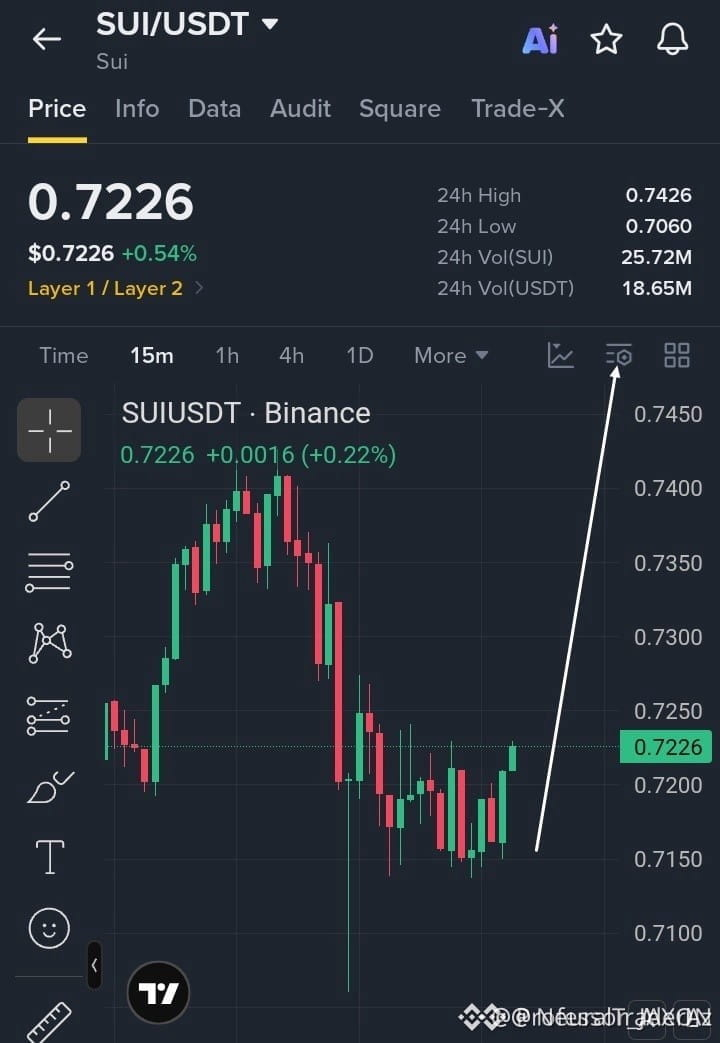
🚨 $SUI SWEEPING THE RANGE LOWS AND PREPARING FOR A CLEAN RESISTANCE BREAK! 💥
Entry: 0.7220 ⚡
Target: 0.7350 🚀
Stop Loss: 0.7140 ⚠️
Order flow on the lower timeframes indicates a textbook accumulation phase as price defends the 0.7150 liquidity pool with high-volume absorption. 📊 Buyers are methodically stepping in to reclaim structural equilibrium above the local mean.
The immediate bottleneck sits right at the 0.7250 resistance shelf, where trapped breakout liquidity is clustered waiting to be cleared. ⚡ Once this inefficiency fills, expect rapid acceleration toward higher institutional targets.
💬 Are you positioning ahead of the breakout or waiting for a retest confirmation? 👇
⚠️ Not financial advice. Always manage your risk. 🛡️
🏷️ #SUI #LongSetup #SmartMoney #Crypto
🔥 💎
🚨 $SUI SWEEPING THE RANGE LOWS AND PREPARING FOR A CLEAN RESISTANCE BREAK! 💥
Entry: 0.7220 ⚡
Target: 0.7350 🚀
Stop Loss: 0.7140 ⚠️
Order flow on the lower timeframes indicates a textbook accumulation phase as price defends the 0.7150 liquidity pool with high-volume absorption. 📊 Buyers are methodically stepping in to reclaim structural equilibrium above the local mean.
The immediate bottleneck sits right at the 0.7250 resistance shelf, where trapped breakout liquidity is clustered waiting to be cleared. ⚡ Once this inefficiency fills, expect rapid acceleration toward higher institutional targets.
💬 Are you positioning ahead of the breakout or waiting for a retest confirmation? 👇
⚠️ Not financial advice. Always manage your risk. 🛡️
🏷️ #SUI #LongSetup #SmartMoney #Crypto
🔥 💎
Entry: 0.7220 ⚡
Target: 0.7350 🚀
Stop Loss: 0.7140 ⚠️
Order flow on the lower timeframes indicates a textbook accumulation phase as price defends the 0.7150 liquidity pool with high-volume absorption. 📊 Buyers are methodically stepping in to reclaim structural equilibrium above the local mean.
The immediate bottleneck sits right at the 0.7250 resistance shelf, where trapped breakout liquidity is clustered waiting to be cleared. ⚡ Once this inefficiency fills, expect rapid acceleration toward higher institutional targets.
💬 Are you positioning ahead of the breakout or waiting for a retest confirmation? 👇
⚠️ Not financial advice. Always manage your risk. 🛡️
🏷️ #SUI #LongSetup #SmartMoney #Crypto
🔥 💎
1

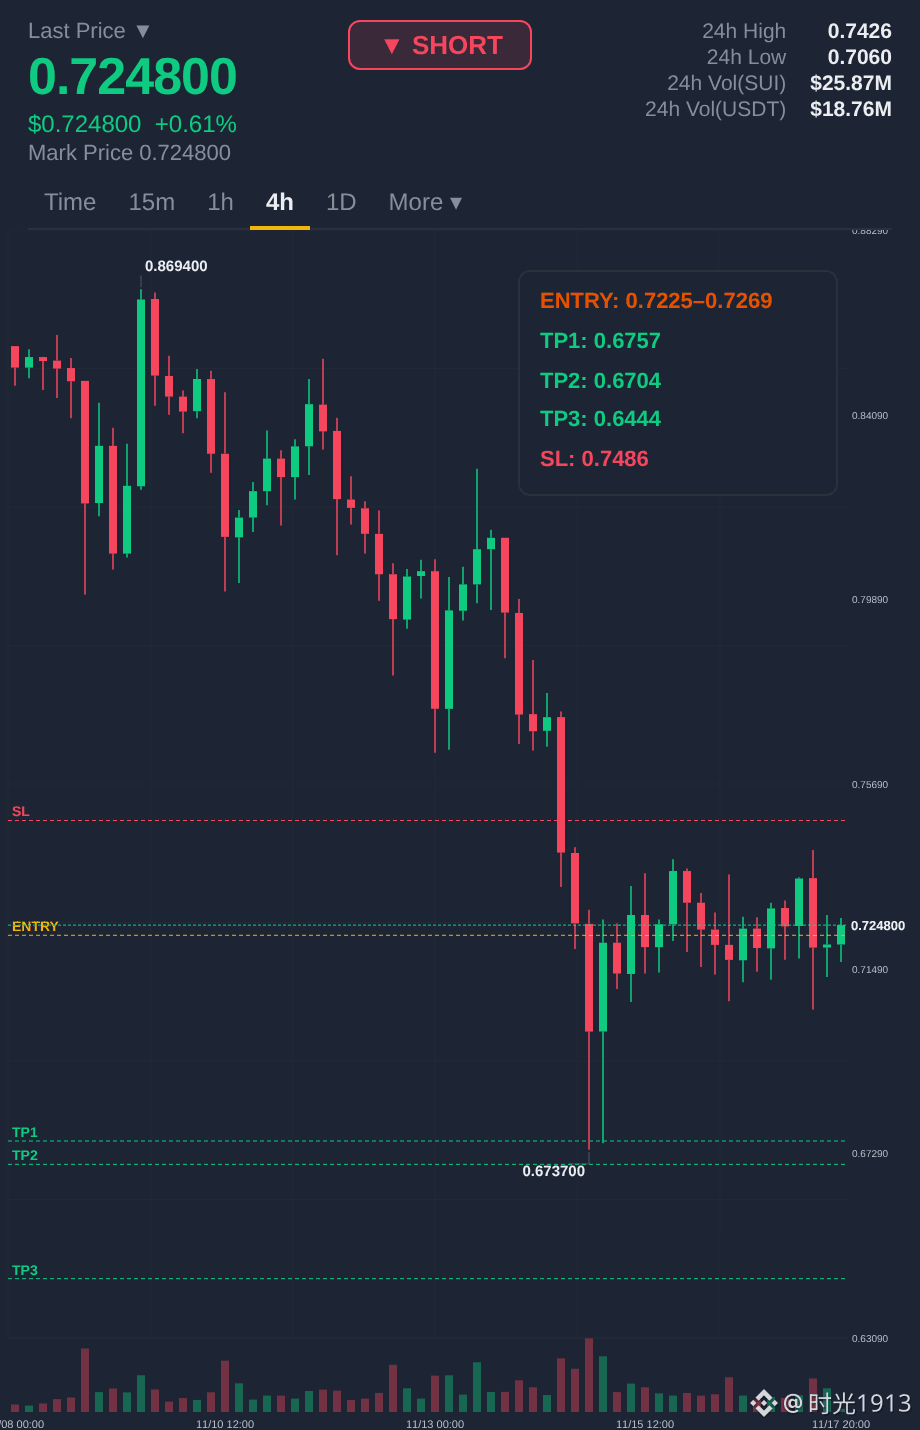

SUI is quietly doing something interesting while everyone watches $BTC.
$SUI ~$0.72 — down ~12% this week, but it bounced off $0.676 on Nov 14-15 and is holding above $0.71. Still -86% from its $5.35 ATH (Jan 2025), and nearly 2x above its $0.36 ATL.
Support: $0.71, then $0.676. Resistance: $0.74, then $0.80.
BTC ~$63,800 is stuck under $64K into Nvidia earnings tonight and Fed minutes tomorrow — if BTC holds $62K, beaten-down alts like SUI are where the bounce math gets interesting.
Not financial advice. DYOR.
#SUI #Altcoins #Crypto
SUI is quietly doing something interesting while everyone watches $BTC .
$SUI ~$0.72 — down ~12% this week, but it bounced off $0.676 on Nov 14-15 and is holding above $0.71. Still -86% from its $5.35 ATH (Jan 2025), and nearly 2x above its $0.36 ATL.
Support: $0.71, then $0.676. Resistance: $0.74, then $0.80.
BTC ~$63,800 is stuck under $64K into Nvidia earnings tonight and Fed minutes tomorrow — if BTC holds $62K, beaten-down alts like SUI are where the bounce math gets interesting.
Not financial advice. DYOR.
#SUI #Altcoins #Crypto
$SUI ~$0.72 — down ~12% this week, but it bounced off $0.676 on Nov 14-15 and is holding above $0.71. Still -86% from its $5.35 ATH (Jan 2025), and nearly 2x above its $0.36 ATL.
Support: $0.71, then $0.676. Resistance: $0.74, then $0.80.
BTC ~$63,800 is stuck under $64K into Nvidia earnings tonight and Fed minutes tomorrow — if BTC holds $62K, beaten-down alts like SUI are where the bounce math gets interesting.
Not financial advice. DYOR.
#SUI #Altcoins #Crypto

SUI, AVAX and LINK: Oversold Momentum Meets a Critical Test of Buyer Conviction
The latest Binance market data shows SUI, AVAX and LINK trading in a high pressure environment where all three assets remain below their key moving averages, while short term momentum has reached oversold conditions. This combination often creates sharp reactions, but it does not by itself confirm that a broader recovery is underway.
The market is currently testing a simple but important question: can buyers turn oversold conditions into sustained demand, or will rallies continue to face selling pressure as the wider technical trend remains weak?
SUI is trading near $0.7198, broadly flat in the current session after moving between $0.7060 and $0.7426. While the small daily move may look quiet, the wider picture remains volatile. SUI is down 14.86% over the past 7 days and 26.27% over the past 30 days, highlighting the scale of the recent retracement.
The technical structure remains cautious. SUI is below its 7 day moving average of $0.7575, 25 day moving average of $0.85142, and 99 day moving average of $0.88762. The moving averages are bearishly aligned, while MACD remains in a bearish phase and SuperTrend points downward. These indicators show that sellers still hold the broader trend advantage.
At the same time, SUI’s RSI is 27.23, placing the asset in oversold territory. This indicates that downside momentum has been persistent and may be becoming stretched. Still, oversold conditions are best viewed as a signal of elevated sensitivity rather than certainty of an immediate rebound. A recovery would need to be supported by improving demand and stronger market participation.
Current volume is only 65% of the 7 day average, suggesting that activity has cooled after the recent decline. Capital flow is also negative, with a net outflow of about 1.49 million SUI. That means buyers have not yet shown clear control of the current range. The most constructive development for SUI would be a sustained improvement in volume and flow while price begins to regain its short term trend structure.
AVAX is trading around $7.083, down 0.87% from its 24 hour open of $7.145. The asset recorded a session high of $7.295 and a low of $6.957, showing that buyers are attempting to defend the lower end of the range. AVAX is down 18.17% over the past 7 days and 27.49% over the past 30 days, making its recent correction more severe than SUI’s.
AVAX is below its 7 day moving average of $7.68, 25 day moving average of $8.32, and 99 day moving average of $8.66. MACD recently confirmed a bearish death cross, and SuperTrend remains downward. The broader chart structure has therefore not yet shifted in favor of buyers.
However, AVAX has an RSI of 25.82, which is deeply oversold. More notably, the latest data shows net capital inflow of approximately 178,224 AVAX, equal to an inflow rate of 9.67%. This is an important contrast to SUI because it indicates that some market participants are absorbing supply while AVAX trades near its recent lows.
Volume remains below average at 66% of the 7 day average, so the inflow still needs confirmation through stronger participation. If volume expands alongside continued positive capital flow, it would suggest that the market is building a more durable foundation. If activity stays muted, the price may remain vulnerable to another volatility spike.
LINK is trading near $9.091, down 0.83% from its 24 hour open of $9.167. Its session range has extended from $8.937 to $9.379, reflecting active trading but limited upside follow through. LINK is down 14.73% over the past 7 days and 24.14% over the past 30 days.
The technical position remains under pressure. LINK trades below its 7 day moving average of $9.52, 25 day moving average of $10.68, and 99 day moving average of $11.72. MACD remains bearish and SuperTrend continues to signal a downward trend. These indicators show that LINK has not yet regained its medium term structure.
Its RSI stands at 26.26, also in oversold territory. Like SUI and AVAX, this shows that recent selling has been intense. Yet LINK’s capital flow offers a more constructive signal, with a net inflow of around 43,492 LINK and an inflow rate of 4.39%. The asset is attracting some buyer interest near current levels, although volume is only 54% of the 7 day average, the lowest participation level among the three.
The broader takeaway is that SUI, AVAX and LINK are all navigating bearish technical structures after substantial weekly and monthly declines. SUI remains pressured by negative capital flow. AVAX stands out for its stronger positive inflow near oversold levels. LINK is also recording positive flow, but lower volume means its recovery case still requires stronger market confirmation.
Oversold RSI readings can lead to sharp relief rallies, but price action becomes more credible only when capital inflows persist, volume strengthens, and assets reclaim key moving averages. In the current environment, patience, risk management, and close attention to participation matter more than reacting to individual candles.
#SUI #AVAX #Chainlink #CryptoMarket #MarketAnalysis
$SUI
{spot}(SUIUSDT)
$AVAX
{spot}(AVAXUSDT)
$LINK
{spot}(LINKUSDT)
SUI, AVAX and LINK: Oversold Momentum Meets a Critical Test of Buyer Conviction
The latest Binance market data shows SUI, AVAX and LINK trading in a high pressure environment where all three assets remain below their key moving averages, while short term momentum has reached oversold conditions. This combination often creates sharp reactions, but it does not by itself confirm that a broader recovery is underway.
The market is currently testing a simple but important question: can buyers turn oversold conditions into sustained demand, or will rallies continue to face selling pressure as the wider technical trend remains weak?
SUI is trading near $0.7198, broadly flat in the current session after moving between $0.7060 and $0.7426. While the small daily move may look quiet, the wider picture remains volatile. SUI is down 14.86% over the past 7 days and 26.27% over the past 30 days, highlighting the scale of the recent retracement.
The technical structure remains cautious. SUI is below its 7 day moving average of $0.7575, 25 day moving average of $0.85142, and 99 day moving average of $0.88762. The moving averages are bearishly aligned, while MACD remains in a bearish phase and SuperTrend points downward. These indicators show that sellers still hold the broader trend advantage.
At the same time, SUI’s RSI is 27.23, placing the asset in oversold territory. This indicates that downside momentum has been persistent and may be becoming stretched. Still, oversold conditions are best viewed as a signal of elevated sensitivity rather than certainty of an immediate rebound. A recovery would need to be supported by improving demand and stronger market participation.
Current volume is only 65% of the 7 day average, suggesting that activity has cooled after the recent decline. Capital flow is also negative, with a net outflow of about 1.49 million SUI. That means buyers have not yet shown clear control of the current range. The most constructive development for SUI would be a sustained improvement in volume and flow while price begins to regain its short term trend structure.
AVAX is trading around $7.083, down 0.87% from its 24 hour open of $7.145. The asset recorded a session high of $7.295 and a low of $6.957, showing that buyers are attempting to defend the lower end of the range. AVAX is down 18.17% over the past 7 days and 27.49% over the past 30 days, making its recent correction more severe than SUI’s.
AVAX is below its 7 day moving average of $7.68, 25 day moving average of $8.32, and 99 day moving average of $8.66. MACD recently confirmed a bearish death cross, and SuperTrend remains downward. The broader chart structure has therefore not yet shifted in favor of buyers.
However, AVAX has an RSI of 25.82, which is deeply oversold. More notably, the latest data shows net capital inflow of approximately 178,224 AVAX, equal to an inflow rate of 9.67%. This is an important contrast to SUI because it indicates that some market participants are absorbing supply while AVAX trades near its recent lows.
Volume remains below average at 66% of the 7 day average, so the inflow still needs confirmation through stronger participation. If volume expands alongside continued positive capital flow, it would suggest that the market is building a more durable foundation. If activity stays muted, the price may remain vulnerable to another volatility spike.
LINK is trading near $9.091, down 0.83% from its 24 hour open of $9.167. Its session range has extended from $8.937 to $9.379, reflecting active trading but limited upside follow through. LINK is down 14.73% over the past 7 days and 24.14% over the past 30 days.
The technical position remains under pressure. LINK trades below its 7 day moving average of $9.52, 25 day moving average of $10.68, and 99 day moving average of $11.72. MACD remains bearish and SuperTrend continues to signal a downward trend. These indicators show that LINK has not yet regained its medium term structure.
Its RSI stands at 26.26, also in oversold territory. Like SUI and AVAX, this shows that recent selling has been intense. Yet LINK’s capital flow offers a more constructive signal, with a net inflow of around 43,492 LINK and an inflow rate of 4.39%. The asset is attracting some buyer interest near current levels, although volume is only 54% of the 7 day average, the lowest participation level among the three.
The broader takeaway is that SUI, AVAX and LINK are all navigating bearish technical structures after substantial weekly and monthly declines. SUI remains pressured by negative capital flow. AVAX stands out for its stronger positive inflow near oversold levels. LINK is also recording positive flow, but lower volume means its recovery case still requires stronger market confirmation.
Oversold RSI readings can lead to sharp relief rallies, but price action becomes more credible only when capital inflows persist, volume strengthens, and assets reclaim key moving averages. In the current environment, patience, risk management, and close attention to participation matter more than reacting to individual candles.
#SUI #AVAX #Chainlink #CryptoMarket #MarketAnalysis
$SUI
$AVAX
$LINK
The market is currently testing a simple but important question: can buyers turn oversold conditions into sustained demand, or will rallies continue to face selling pressure as the wider technical trend remains weak?
SUI is trading near $0.7198, broadly flat in the current session after moving between $0.7060 and $0.7426. While the small daily move may look quiet, the wider picture remains volatile. SUI is down 14.86% over the past 7 days and 26.27% over the past 30 days, highlighting the scale of the recent retracement.
The technical structure remains cautious. SUI is below its 7 day moving average of $0.7575, 25 day moving average of $0.85142, and 99 day moving average of $0.88762. The moving averages are bearishly aligned, while MACD remains in a bearish phase and SuperTrend points downward. These indicators show that sellers still hold the broader trend advantage.
At the same time, SUI’s RSI is 27.23, placing the asset in oversold territory. This indicates that downside momentum has been persistent and may be becoming stretched. Still, oversold conditions are best viewed as a signal of elevated sensitivity rather than certainty of an immediate rebound. A recovery would need to be supported by improving demand and stronger market participation.
Current volume is only 65% of the 7 day average, suggesting that activity has cooled after the recent decline. Capital flow is also negative, with a net outflow of about 1.49 million SUI. That means buyers have not yet shown clear control of the current range. The most constructive development for SUI would be a sustained improvement in volume and flow while price begins to regain its short term trend structure.
AVAX is trading around $7.083, down 0.87% from its 24 hour open of $7.145. The asset recorded a session high of $7.295 and a low of $6.957, showing that buyers are attempting to defend the lower end of the range. AVAX is down 18.17% over the past 7 days and 27.49% over the past 30 days, making its recent correction more severe than SUI’s.
AVAX is below its 7 day moving average of $7.68, 25 day moving average of $8.32, and 99 day moving average of $8.66. MACD recently confirmed a bearish death cross, and SuperTrend remains downward. The broader chart structure has therefore not yet shifted in favor of buyers.
However, AVAX has an RSI of 25.82, which is deeply oversold. More notably, the latest data shows net capital inflow of approximately 178,224 AVAX, equal to an inflow rate of 9.67%. This is an important contrast to SUI because it indicates that some market participants are absorbing supply while AVAX trades near its recent lows.
Volume remains below average at 66% of the 7 day average, so the inflow still needs confirmation through stronger participation. If volume expands alongside continued positive capital flow, it would suggest that the market is building a more durable foundation. If activity stays muted, the price may remain vulnerable to another volatility spike.
LINK is trading near $9.091, down 0.83% from its 24 hour open of $9.167. Its session range has extended from $8.937 to $9.379, reflecting active trading but limited upside follow through. LINK is down 14.73% over the past 7 days and 24.14% over the past 30 days.
The technical position remains under pressure. LINK trades below its 7 day moving average of $9.52, 25 day moving average of $10.68, and 99 day moving average of $11.72. MACD remains bearish and SuperTrend continues to signal a downward trend. These indicators show that LINK has not yet regained its medium term structure.
Its RSI stands at 26.26, also in oversold territory. Like SUI and AVAX, this shows that recent selling has been intense. Yet LINK’s capital flow offers a more constructive signal, with a net inflow of around 43,492 LINK and an inflow rate of 4.39%. The asset is attracting some buyer interest near current levels, although volume is only 54% of the 7 day average, the lowest participation level among the three.
The broader takeaway is that SUI, AVAX and LINK are all navigating bearish technical structures after substantial weekly and monthly declines. SUI remains pressured by negative capital flow. AVAX stands out for its stronger positive inflow near oversold levels. LINK is also recording positive flow, but lower volume means its recovery case still requires stronger market confirmation.
Oversold RSI readings can lead to sharp relief rallies, but price action becomes more credible only when capital inflows persist, volume strengthens, and assets reclaim key moving averages. In the current environment, patience, risk management, and close attention to participation matter more than reacting to individual candles.
#SUI #AVAX #Chainlink #CryptoMarket #MarketAnalysis
$SUI
$AVAX
$LINK
8
·
--
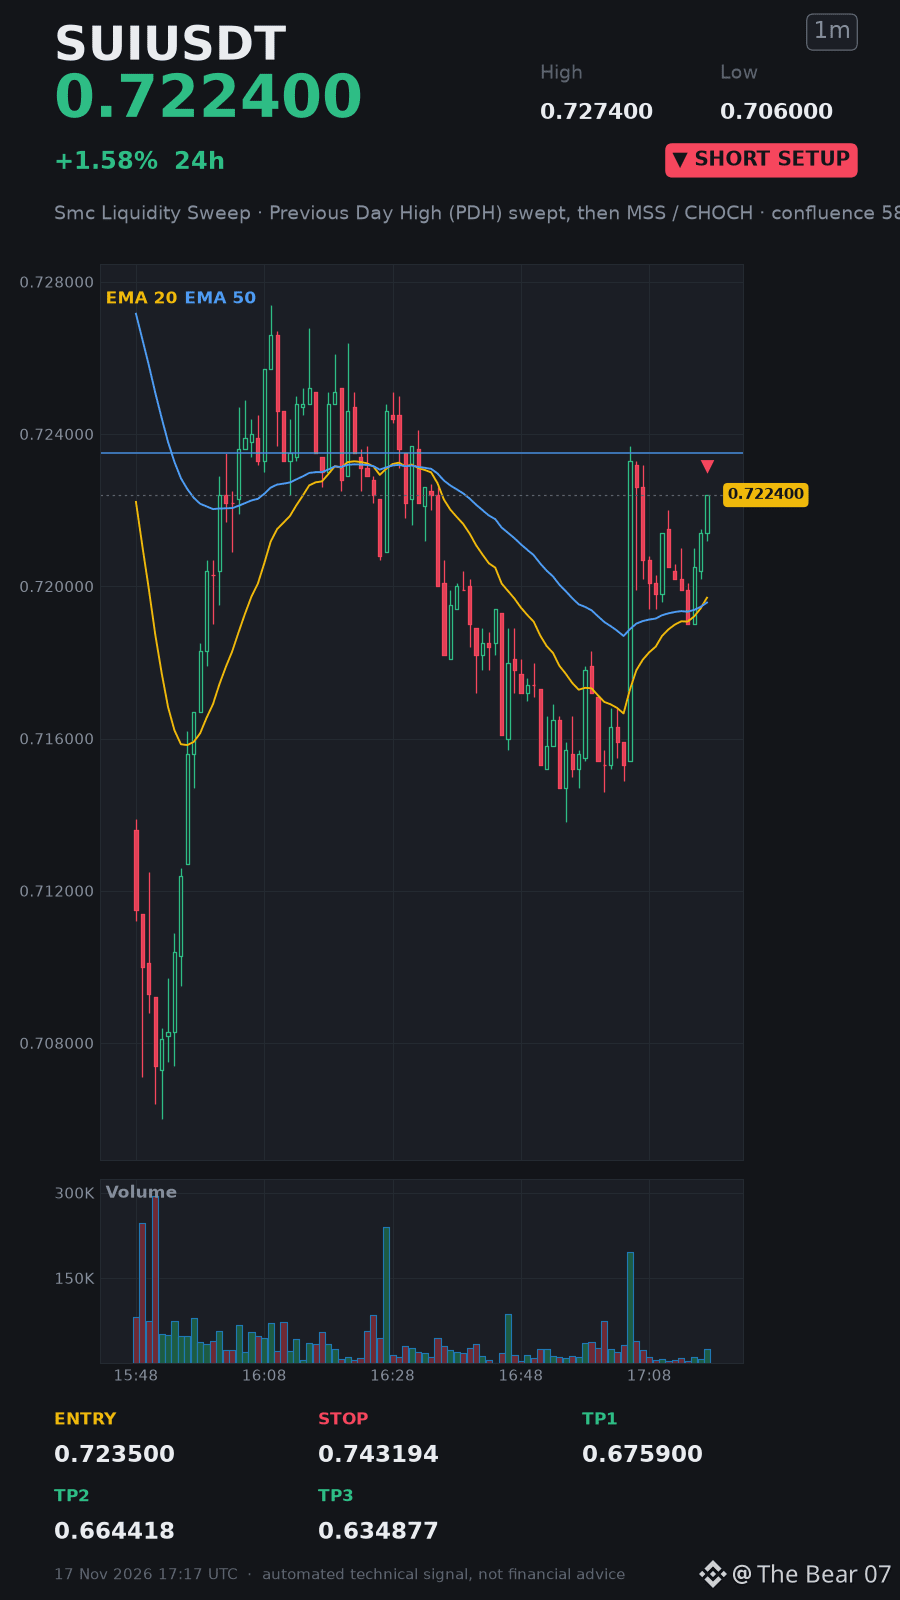
🚨 #SUI SMC LIQUIDITY SWEEP REVERSE! 🤯⚡
I'm going short on this setup $SUI 👇
Short..... Quick..... Watch the melt..... Boom.....‼️‼️‼️
Entry: 0.7235 – 0.7243
Stop-loss: 0.7432
🟢 TP1: 0.6759
🟢 TP2: 0.6644
🟢 TP3: 0.6349
Join me, trade the move now 👇⬇️⬇️ Short.. With meee...👇⬇️ $SUI
🚨 #SUI SMC LIQUIDITY SWEEP REVERSE! 🤯⚡
I'm going short on this setup $SUI 👇
Short..... Quick..... Watch the melt..... Boom.....‼️‼️‼️
Entry: 0.7235 – 0.7243
Stop-loss: 0.7432
🟢 TP1: 0.6759
🟢 TP2: 0.6644
🟢 TP3: 0.6349
Join me, trade the move now 👇⬇️⬇️ Short.. With meee...👇⬇️ $SUI
I'm going short on this setup $SUI 👇
Short..... Quick..... Watch the melt..... Boom.....‼️‼️‼️
Entry: 0.7235 – 0.7243
Stop-loss: 0.7432
🟢 TP1: 0.6759
🟢 TP2: 0.6644
🟢 TP3: 0.6349
Join me, trade the move now 👇⬇️⬇️ Short.. With meee...👇⬇️ $SUI
8

·
--
$SUI volume is sitting at 0.6x its weekly average and most traders are ignoring it
Price is at 0.71990 up just 0.1 percent today but that flat look hides a trap
Volume tells you if actual money is moving or if the market is just drifting
Right now 24h volume is 18.1M which is way below normal
When a move happens on low volume it usually means no one cares and it fades fast
You check this on your chart by dividing today volume by the 7 day average line
If the ratio is below 1 like our 0.6x here do not trust any breakout you see
Always check the volume ratio before you enter a trade
Open $SUI and set an alert at that level
What volume ratio do you wait for before opening a position
#SUI #TradingTips
$SUI volume is sitting at 0.6x its weekly average and most traders are ignoring it
Price is at 0.71990 up just 0.1 percent today but that flat look hides a trap
Volume tells you if actual money is moving or if the market is just drifting
Right now 24h volume is 18.1M which is way below normal
When a move happens on low volume it usually means no one cares and it fades fast
You check this on your chart by dividing today volume by the 7 day average line
If the ratio is below 1 like our 0.6x here do not trust any breakout you see
Always check the volume ratio before you enter a trade
Open $SUI and set an alert at that level
What volume ratio do you wait for before opening a position
#SUI #TradingTips
Price is at 0.71990 up just 0.1 percent today but that flat look hides a trap
Volume tells you if actual money is moving or if the market is just drifting
Right now 24h volume is 18.1M which is way below normal
When a move happens on low volume it usually means no one cares and it fades fast
You check this on your chart by dividing today volume by the 7 day average line
If the ratio is below 1 like our 0.6x here do not trust any breakout you see
Always check the volume ratio before you enter a trade
Open $SUI and set an alert at that level
What volume ratio do you wait for before opening a position
#SUI #TradingTips
4
·
--
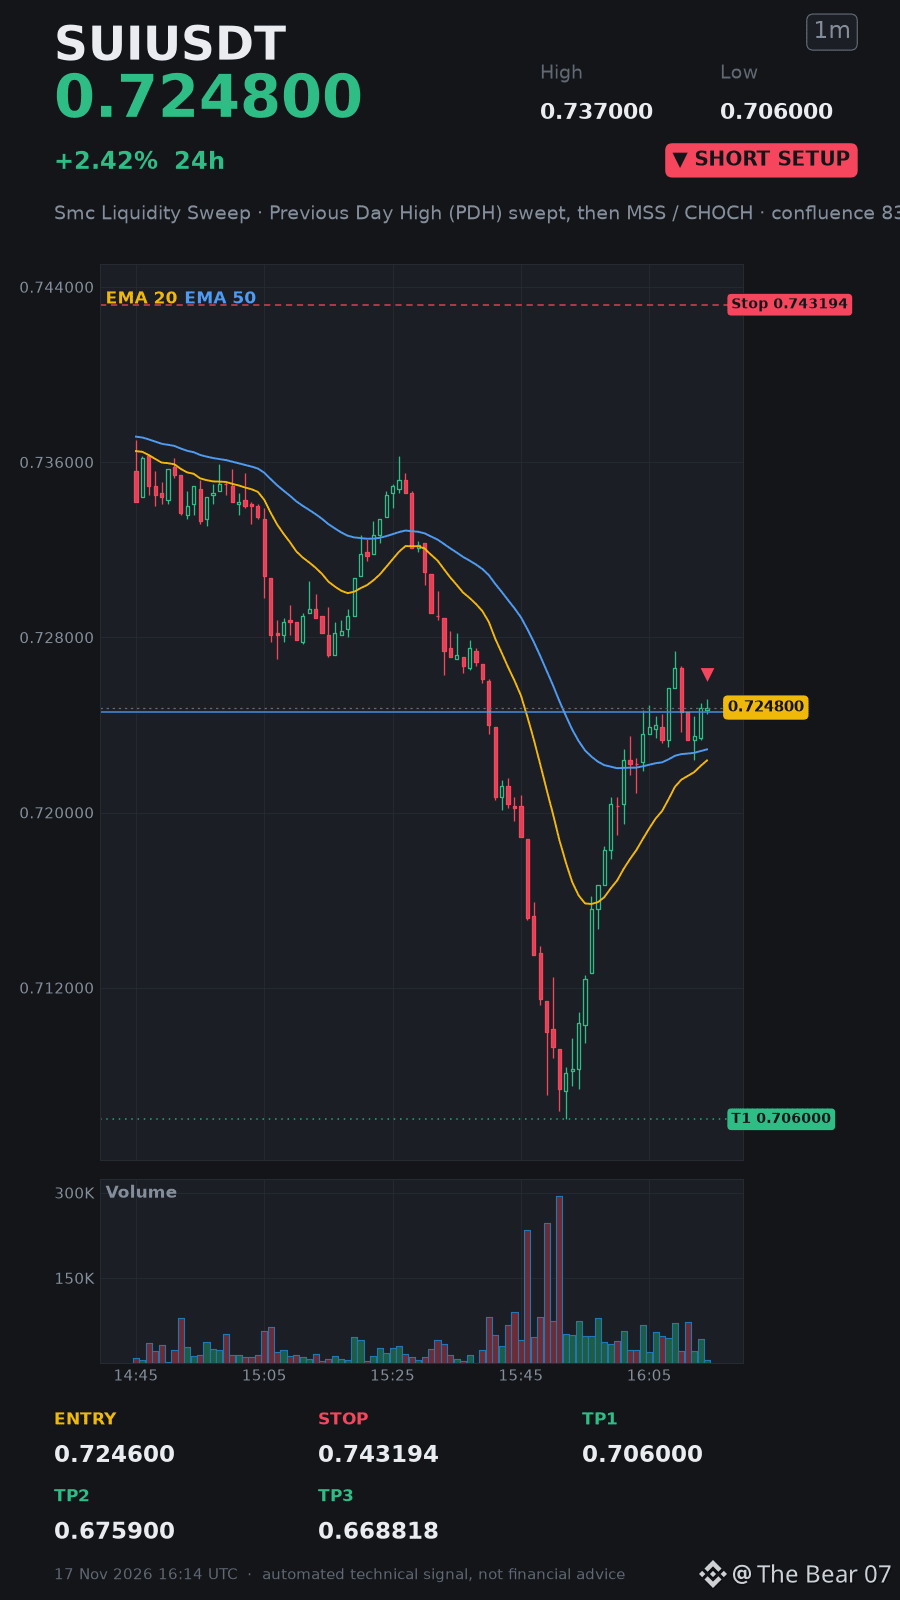
🚨 #SUI BEARISH SWEEP IGNITES SHORT FURY! 🤯📉
I'm jumping in on the short. $SUI 👇
Short..... Quick..... Ride the wave.....‼️‼️‼️
Entry: 0.7246 – 0.7257
Stop-loss: 0.7432
🟢 TP1: 0.706
🟢 TP2: 0.6759
🟢 TP3: 0.6688
Copy my trade now! 👇⬇️⬇️ Short.. With meee...👇⬇️ $SUI
🚨 #SUI BEARISH SWEEP IGNITES SHORT FURY! 🤯📉
I'm jumping in on the short. $SUI 👇
Short..... Quick..... Ride the wave.....‼️‼️‼️
Entry: 0.7246 – 0.7257
Stop-loss: 0.7432
🟢 TP1: 0.706
🟢 TP2: 0.6759
🟢 TP3: 0.6688
Copy my trade now! 👇⬇️⬇️ Short.. With meee...👇⬇️ $SUI
I'm jumping in on the short. $SUI 👇
Short..... Quick..... Ride the wave.....‼️‼️‼️
Entry: 0.7246 – 0.7257
Stop-loss: 0.7432
🟢 TP1: 0.706
🟢 TP2: 0.6759
🟢 TP3: 0.6688
Copy my trade now! 👇⬇️⬇️ Short.. With meee...👇⬇️ $SUI
4

·
--
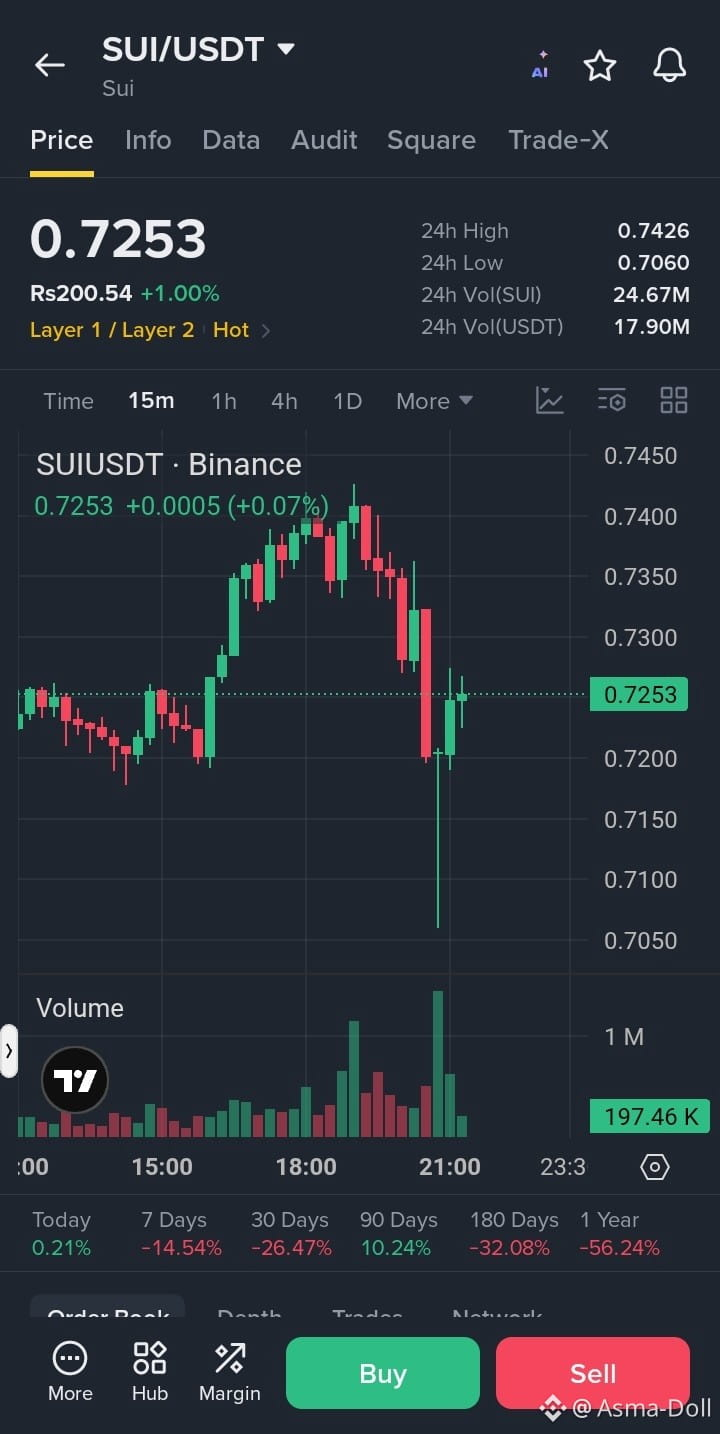
$SUI /USDT – SHORT SIGNAL 📉
Entry Zone: $0.7240 – $0.7300
Stop Loss (SL): $0.7460
Take Profit Targets:
* TP1: $0.7150
* TP2: $0.7060
* TP3: $0.6950
Trade here $SUI
{future}(SUIUSDT)
Analysis:
* Price is struggling below the $0.7426 resistance.
* Short-term recovery remains weak.
* Price is near the $0.7200 support zone.
* A breakdown could trigger further selling pressure.
* Broader 7-day and 30-day performance remains negative.
Confirmation: A clean 15m candle close below $0.7200 with strong selling volume can confirm bearish continuation.
Risk-to-Reward: Approximately 1:1.3 to 1:2.5, depending on entry and target.
⚠️ Avoid entering directly into support. Wait for breakdown or a confirmed resistance rejection.
#SUI #SUIUSDT #CryptoSignals #BinanceFutures #ShortSignal
$SUI /USDT – SHORT SIGNAL 📉
Entry Zone: $0.7240 – $0.7300
Stop Loss (SL): $0.7460
Take Profit Targets:
* TP1: $0.7150
* TP2: $0.7060
* TP3: $0.6950
Trade here $SUI
Analysis:
* Price is struggling below the $0.7426 resistance.
* Short-term recovery remains weak.
* Price is near the $0.7200 support zone.
* A breakdown could trigger further selling pressure.
* Broader 7-day and 30-day performance remains negative.
Confirmation: A clean 15m candle close below $0.7200 with strong selling volume can confirm bearish continuation.
Risk-to-Reward: Approximately 1:1.3 to 1:2.5, depending on entry and target.
⚠️ Avoid entering directly into support. Wait for breakdown or a confirmed resistance rejection.
#SUI #SUIUSDT #CryptoSignals #BinanceFutures #ShortSignal
Entry Zone: $0.7240 – $0.7300
Stop Loss (SL): $0.7460
Take Profit Targets:
* TP1: $0.7150
* TP2: $0.7060
* TP3: $0.6950
Trade here $SUI
Analysis:
* Price is struggling below the $0.7426 resistance.
* Short-term recovery remains weak.
* Price is near the $0.7200 support zone.
* A breakdown could trigger further selling pressure.
* Broader 7-day and 30-day performance remains negative.
Confirmation: A clean 15m candle close below $0.7200 with strong selling volume can confirm bearish continuation.
Risk-to-Reward: Approximately 1:1.3 to 1:2.5, depending on entry and target.
⚠️ Avoid entering directly into support. Wait for breakdown or a confirmed resistance rejection.
#SUI #SUIUSDT #CryptoSignals #BinanceFutures #ShortSignal
37
·
--
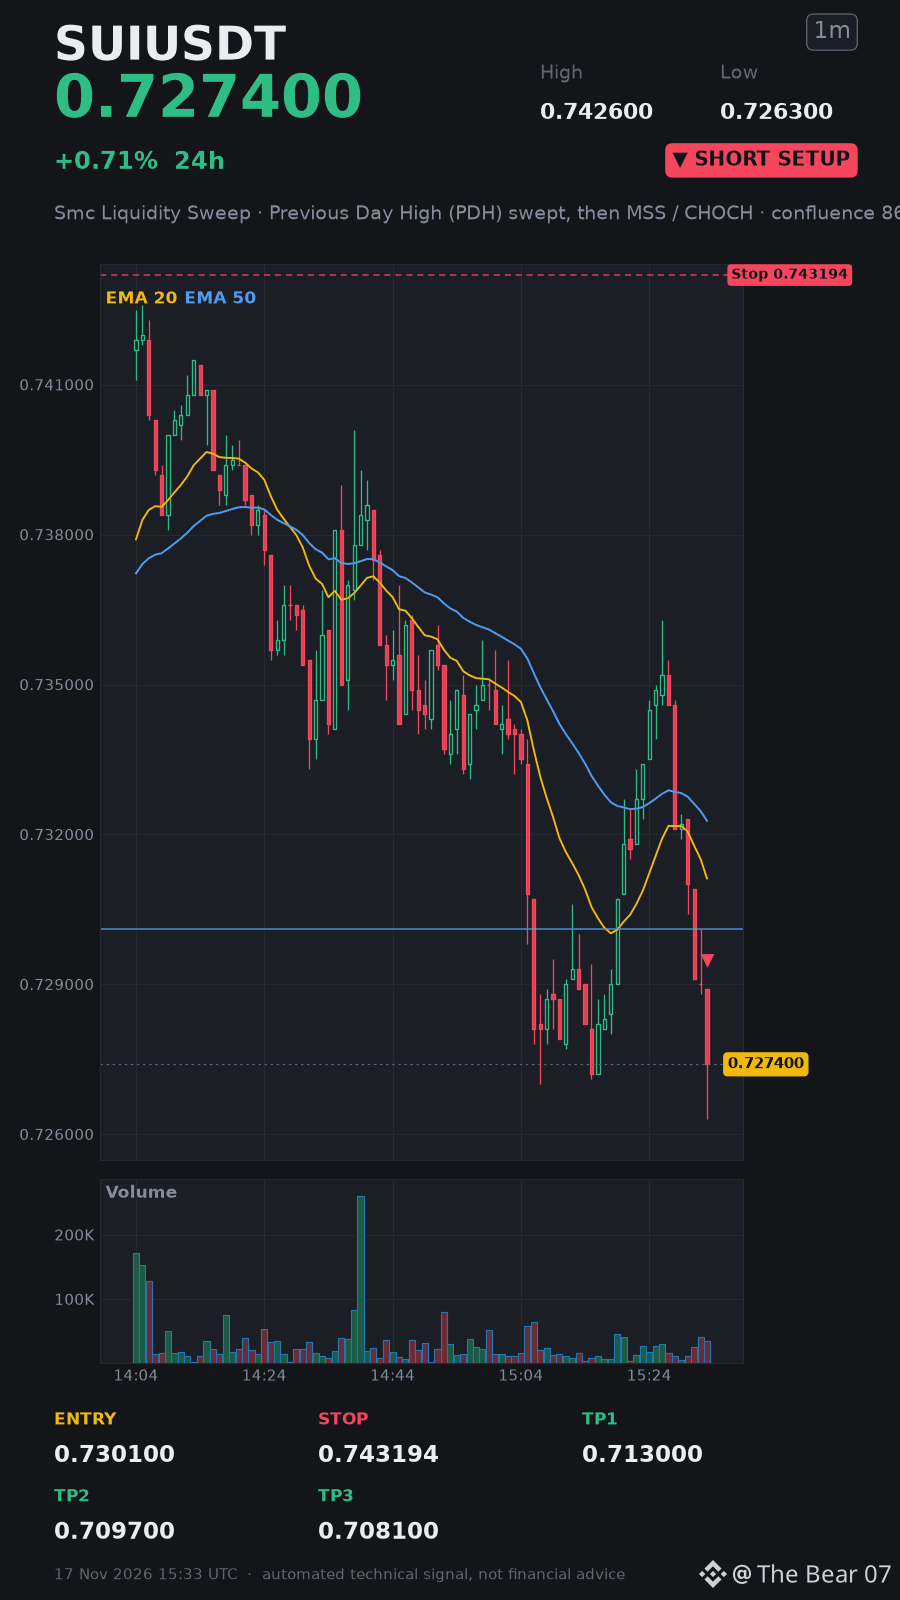
🚨 #SUI Bearish Sweep Hits Hard! 🤯🩸
I'm shorting this now. $SUI 👇
Short..... Quick..... Feel the rush.....‼️‼️‼️
Entry: 0.7301 – 0.7304
Stop-loss: 0.7432
🟢 TP1: 0.713
🟢 TP2: 0.7097
🟢 TP3: 0.7081
Join me, trade together! 👇⬇️⬇️ Short.. With meee...👇⬇️ $SUI
🚨 #SUI Bearish Sweep Hits Hard! 🤯🩸
I'm shorting this now. $SUI 👇
Short..... Quick..... Feel the rush.....‼️‼️‼️
Entry: 0.7301 – 0.7304
Stop-loss: 0.7432
🟢 TP1: 0.713
🟢 TP2: 0.7097
🟢 TP3: 0.7081
Join me, trade together! 👇⬇️⬇️ Short.. With meee...👇⬇️ $SUI
I'm shorting this now. $SUI 👇
Short..... Quick..... Feel the rush.....‼️‼️‼️
Entry: 0.7301 – 0.7304
Stop-loss: 0.7432
🟢 TP1: 0.713
🟢 TP2: 0.7097
🟢 TP3: 0.7081
Join me, trade together! 👇⬇️⬇️ Short.. With meee...👇⬇️ $SUI
·
--
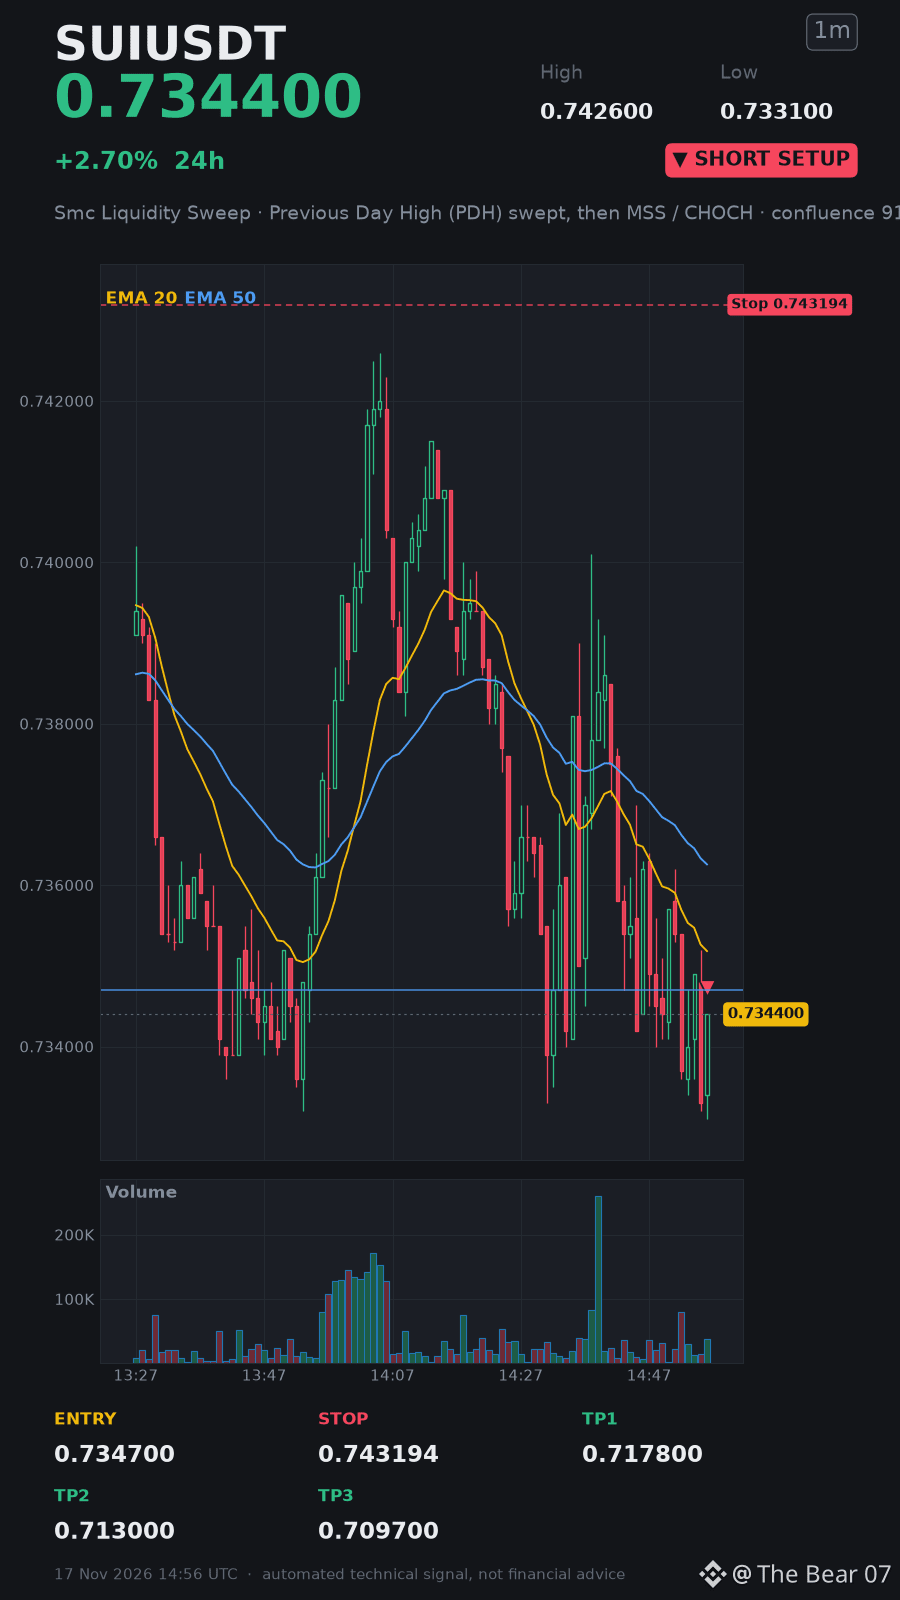
🚨 #SUI SMC SWEEP TRIGGERED! 🤯🐻
I'm shorting hard on this move $SUI 👇
Short..... Fast..... Watch the swing..... Soon.....‼️‼️‼️
Entry: 0.7347 – 0.7353
Stop-loss: 0.7432
🟢 TP1: 0.7178
🟢 TP2: 0.713
🟢 TP3: 0.7097
Join me, trade the dip now 👇⬇️⬇️ Short.. With meee...👇⬇️ $SUI
🚨 #SUI SMC SWEEP TRIGGERED! 🤯🐻
I'm shorting hard on this move $SUI 👇
Short..... Fast..... Watch the swing..... Soon.....‼️‼️‼️
Entry: 0.7347 – 0.7353
Stop-loss: 0.7432
🟢 TP1: 0.7178
🟢 TP2: 0.713
🟢 TP3: 0.7097
Join me, trade the dip now 👇⬇️⬇️ Short.. With meee...👇⬇️ $SUI
I'm shorting hard on this move $SUI 👇
Short..... Fast..... Watch the swing..... Soon.....‼️‼️‼️
Entry: 0.7347 – 0.7353
Stop-loss: 0.7432
🟢 TP1: 0.7178
🟢 TP2: 0.713
🟢 TP3: 0.7097
Join me, trade the dip now 👇⬇️⬇️ Short.. With meee...👇⬇️ $SUI

·
--
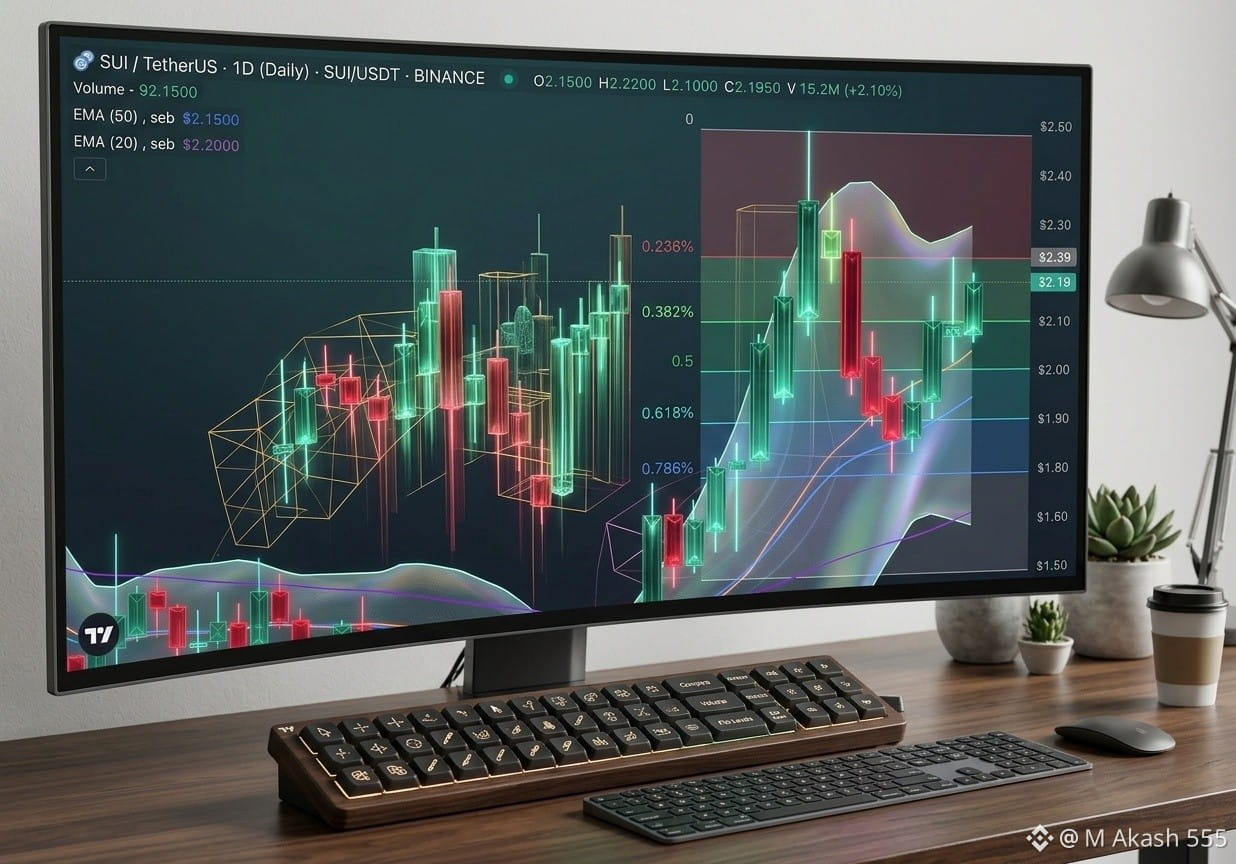
🚨 $SUI AT A MAKE-OR-BREAK ZONE! HUGE MOVE LOADING?! 🚨
$SUI is currently trading around $0.73 after a sharp pullback, and smart money is watching this exact zone closely! 👀📉📈
While weak hands are panicking over the recent dip, on-chain data shows stablecoin liquidity on the Sui network is quietly growing. Right now, the chart is sitting right on a critical decision area:
📊 Key Levels to Watch:
Current Price: ~$0.73
Strong Support: $0.675 – $0.70 (Must hold for a bounce)
Immediate Resistance: $0.78 – $0.80
Breakout Target: $0.85+ 🚀
⚡ The Setup: If buyers defend the $0.70 zone and reclaim $0.78, we could see a fast short squeeze back toward $0.85+. However, losing $0.675 opens the door for deeper discounts before the next leg up.
Are you BUYING THE DIP on $SUI or waiting for a breakout? Drop your target in the comments! 👇🔥
Like & Follow for daily high-accuracy crypto setups! 💎
#SUI #SuiNetwork #CryptoTrading #Altcoins
{spot}(SUIUSDT)
🚨 $SUI AT A MAKE-OR-BREAK ZONE! HUGE MOVE LOADING?! 🚨
$SUI is currently trading around $0.73 after a sharp pullback, and smart money is watching this exact zone closely! 👀📉📈
While weak hands are panicking over the recent dip, on-chain data shows stablecoin liquidity on the Sui network is quietly growing. Right now, the chart is sitting right on a critical decision area:
📊 Key Levels to Watch:
Current Price: ~$0.73
Strong Support: $0.675 – $0.70 (Must hold for a bounce)
Immediate Resistance: $0.78 – $0.80
Breakout Target: $0.85+ 🚀
⚡ The Setup: If buyers defend the $0.70 zone and reclaim $0.78, we could see a fast short squeeze back toward $0.85+. However, losing $0.675 opens the door for deeper discounts before the next leg up.
Are you BUYING THE DIP on $SUI or waiting for a breakout? Drop your target in the comments! 👇🔥
Like & Follow for daily high-accuracy crypto setups! 💎
#SUI #SuiNetwork #CryptoTrading #Altcoins
$SUI is currently trading around $0.73 after a sharp pullback, and smart money is watching this exact zone closely! 👀📉📈
While weak hands are panicking over the recent dip, on-chain data shows stablecoin liquidity on the Sui network is quietly growing. Right now, the chart is sitting right on a critical decision area:
📊 Key Levels to Watch:
Current Price: ~$0.73
Strong Support: $0.675 – $0.70 (Must hold for a bounce)
Immediate Resistance: $0.78 – $0.80
Breakout Target: $0.85+ 🚀
⚡ The Setup: If buyers defend the $0.70 zone and reclaim $0.78, we could see a fast short squeeze back toward $0.85+. However, losing $0.675 opens the door for deeper discounts before the next leg up.
Are you BUYING THE DIP on $SUI or waiting for a breakout? Drop your target in the comments! 👇🔥
Like & Follow for daily high-accuracy crypto setups! 💎
#SUI #SuiNetwork #CryptoTrading #Altcoins
106

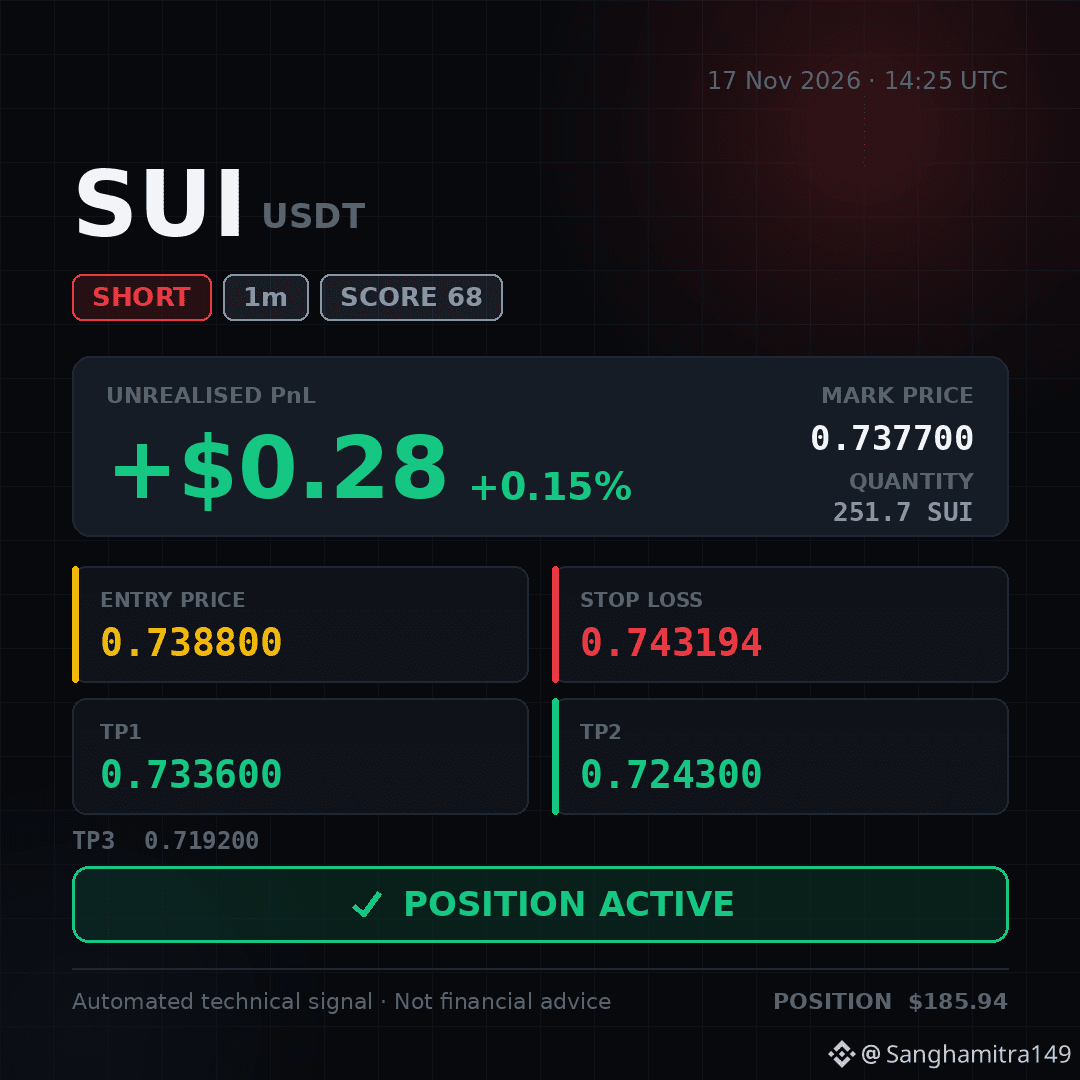
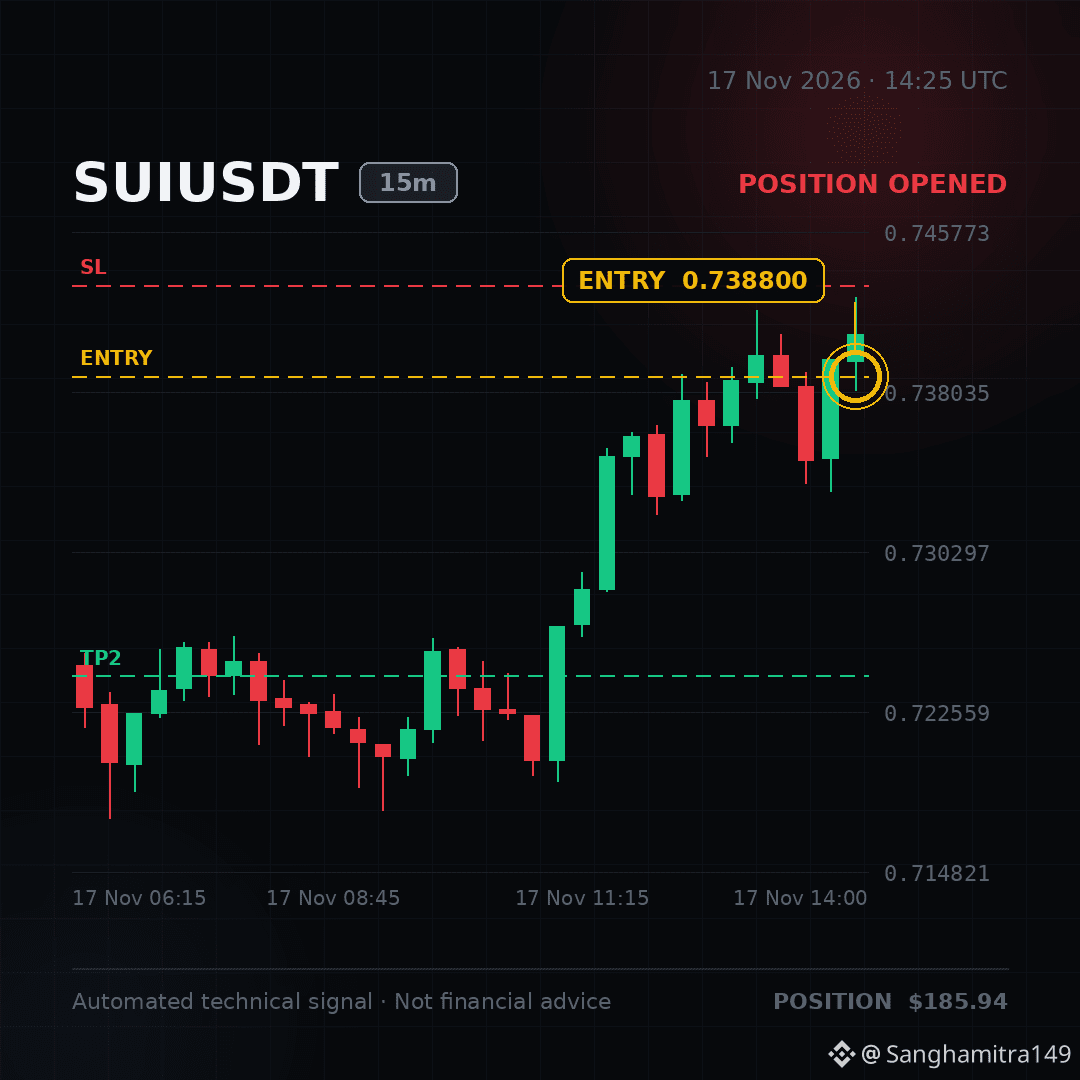
✅ POSITION ACTIVE — I've taken this short. Running at +0.15%.
🚨 #SUI SMC SWEEP SIGNALS SHORT WAVE! 🤯⚡
I'm going short on this. $SUI 👇
Short..... Now..... Feel the pull..... Ride it.....‼️‼️‼️
Entry: 0.7388 – 0.7394
Stop-loss: 0.7432
🟢 TP1: 0.7336
🟢 TP2: 0.7243
🟢 TP3: 0.7192
Join my trade now! 👇⬇️⬇️ Short.. With meee...👇⬇️ $SUI
✅ POSITION ACTIVE — I've taken this short. Running at +0.15%.
🚨 #SUI SMC SWEEP SIGNALS SHORT WAVE! 🤯⚡
I'm going short on this. $SUI 👇
Short..... Now..... Feel the pull..... Ride it.....‼️‼️‼️
Entry: 0.7388 – 0.7394
Stop-loss: 0.7432
🟢 TP1: 0.7336
🟢 TP2: 0.7243
🟢 TP3: 0.7192
Join my trade now! 👇⬇️⬇️ Short.. With meee...👇⬇️ $SUI
🚨 #SUI SMC SWEEP SIGNALS SHORT WAVE! 🤯⚡
I'm going short on this. $SUI 👇
Short..... Now..... Feel the pull..... Ride it.....‼️‼️‼️
Entry: 0.7388 – 0.7394
Stop-loss: 0.7432
🟢 TP1: 0.7336
🟢 TP2: 0.7243
🟢 TP3: 0.7192
Join my trade now! 👇⬇️⬇️ Short.. With meee...👇⬇️ $SUI
1


$SUI: When Price Moves Up Across the Watchlist But Volume Only Expands in One Coin
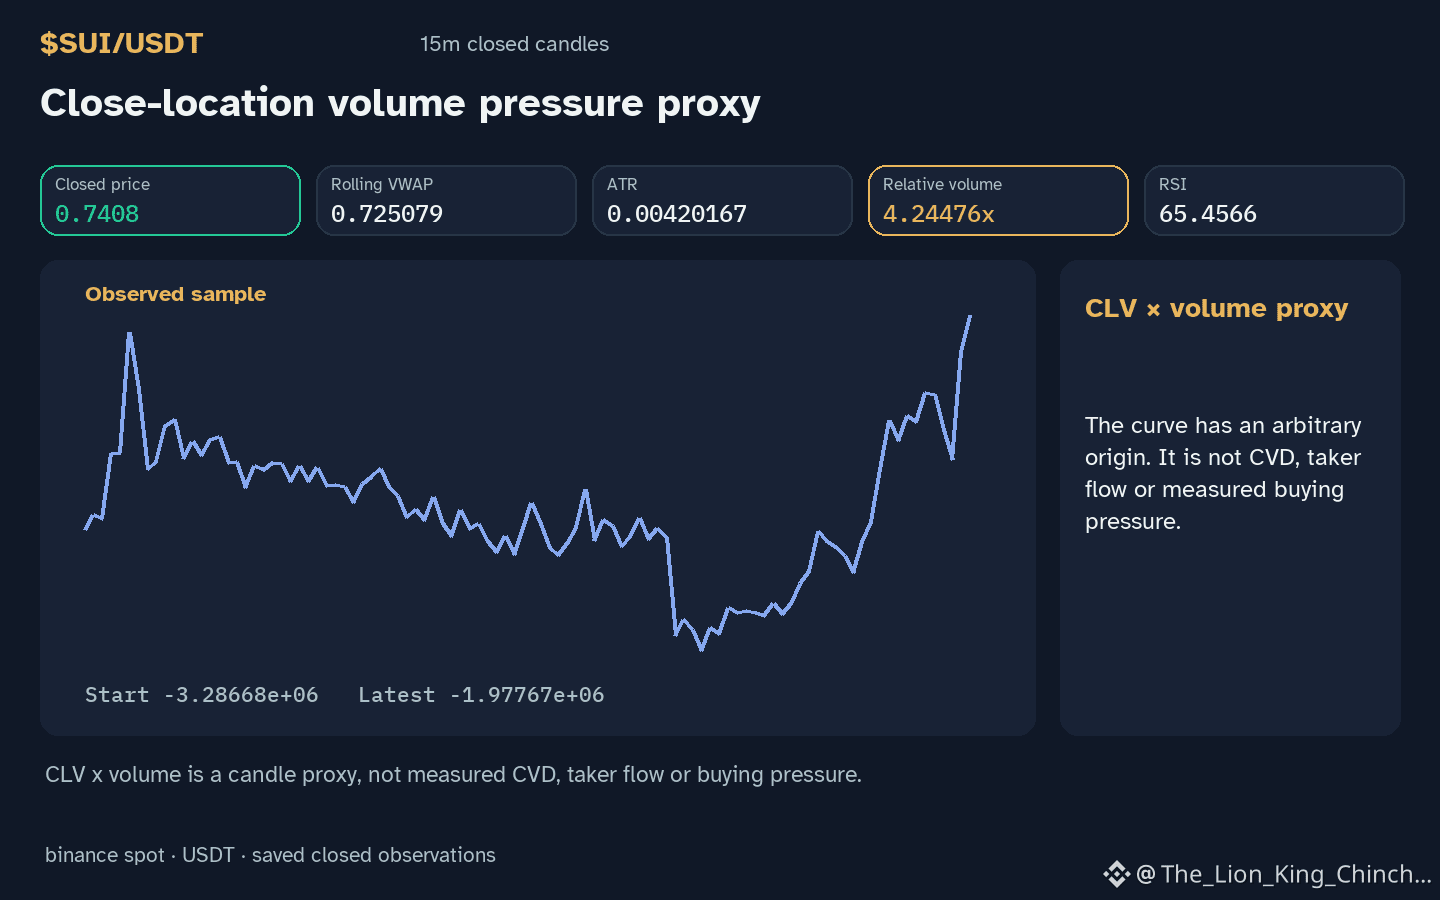
$SUI shows an hourly up direction while relative volume sits at 4.24x baseline. The peer set includes $BTC with hourly down and volume not above baseline, and $BREV with hourly up and volume above baseline. A shared price direction does not imply a shared participation level; the volume expansion appears isolated to one asset rather than a broad watchlist phenomenon. This divergence raises the question of whether the same directional move carries a different risk profile when only one market shows expanded activity.
A hypothetical decision might weigh the up move against the volume backdrop. If a trader treats the hourly up candle as a signal, the expanded volume in $BREV could be read as confirmation, while the absent expansion in $BTC and $SUI might suggest caution. The mechanism is simply that higher relative volume can indicate more participants agreeing with the price change, yet it does not guarantee follow‑through. The same hourly up move in $SUI occurs without that volume expansion, so the participation signal is missing.
Where the analogy helps is in flagging that identical price direction can coexist with different volume contexts. Where it fails is in assuming the volume context transfers across symbols. A counterexample would be a later hour where $SUI also prints expanded volume and the up move continues, showing the earlier divergence was temporary. Future closed‑candle evidence that $SUI sustains its up direction while relative volume returns toward baseline would weaken the idea that participation divergence matters for near‑term risk. Current readings: RSI 65.5, hourly change 0.135172%.
Probabilistic market research, not a recommendation or guaranteed return.
The comparison to keep in mind: $BTC has hourly direction down and volume not above its baseline; $BREV has hourly direction up and volume above its baseline. This alone does not establish correlation.
Same move, but the same risk?
#SUI
$SUI : When Price Moves Up Across the Watchlist But Volume Only Expands in One Coin
$SUI shows an hourly up direction while relative volume sits at 4.24x baseline. The peer set includes $BTC with hourly down and volume not above baseline, and $BREV with hourly up and volume above baseline. A shared price direction does not imply a shared participation level; the volume expansion appears isolated to one asset rather than a broad watchlist phenomenon. This divergence raises the question of whether the same directional move carries a different risk profile when only one market shows expanded activity.
A hypothetical decision might weigh the up move against the volume backdrop. If a trader treats the hourly up candle as a signal, the expanded volume in $BREV could be read as confirmation, while the absent expansion in $BTC and $SUI might suggest caution. The mechanism is simply that higher relative volume can indicate more participants agreeing with the price change, yet it does not guarantee follow‑through. The same hourly up move in $SUI occurs without that volume expansion, so the participation signal is missing.
Where the analogy helps is in flagging that identical price direction can coexist with different volume contexts. Where it fails is in assuming the volume context transfers across symbols. A counterexample would be a later hour where $SUI also prints expanded volume and the up move continues, showing the earlier divergence was temporary. Future closed‑candle evidence that $SUI sustains its up direction while relative volume returns toward baseline would weaken the idea that participation divergence matters for near‑term risk. Current readings: RSI 65.5, hourly change 0.135172%.
Probabilistic market research, not a recommendation or guaranteed return.
The comparison to keep in mind: $BTC has hourly direction down and volume not above its baseline; $BREV has hourly direction up and volume above its baseline. This alone does not establish correlation.
Same move, but the same risk?
#SUI
$SUI shows an hourly up direction while relative volume sits at 4.24x baseline. The peer set includes $BTC with hourly down and volume not above baseline, and $BREV with hourly up and volume above baseline. A shared price direction does not imply a shared participation level; the volume expansion appears isolated to one asset rather than a broad watchlist phenomenon. This divergence raises the question of whether the same directional move carries a different risk profile when only one market shows expanded activity.
A hypothetical decision might weigh the up move against the volume backdrop. If a trader treats the hourly up candle as a signal, the expanded volume in $BREV could be read as confirmation, while the absent expansion in $BTC and $SUI might suggest caution. The mechanism is simply that higher relative volume can indicate more participants agreeing with the price change, yet it does not guarantee follow‑through. The same hourly up move in $SUI occurs without that volume expansion, so the participation signal is missing.
Where the analogy helps is in flagging that identical price direction can coexist with different volume contexts. Where it fails is in assuming the volume context transfers across symbols. A counterexample would be a later hour where $SUI also prints expanded volume and the up move continues, showing the earlier divergence was temporary. Future closed‑candle evidence that $SUI sustains its up direction while relative volume returns toward baseline would weaken the idea that participation divergence matters for near‑term risk. Current readings: RSI 65.5, hourly change 0.135172%.
Probabilistic market research, not a recommendation or guaranteed return.
The comparison to keep in mind: $BTC has hourly direction down and volume not above its baseline; $BREV has hourly direction up and volume above its baseline. This alone does not establish correlation.
Same move, but the same risk?
#SUI
21
Log in to explore more content
Join global crypto users on Binance Square
⚡️ Get latest and useful information about crypto.
💬 Trusted by the world’s largest crypto exchange.
👍 Discover real insights from verified creators.
Email / Phone number
Trending Topics
1
#NvidiaEarningsTonight:AIStocks’NextMove?
112,973 views
1,240 Discussing
2
#A Packed Week of Earnings and Data Tests Markets
143,540 views
652 Discussing
3
#AnthropicIPOTestsInvestorAppetiteForAI
317,533 views
2,851 Discussing
4
#NvidiaBoardNotConsideringHuang’sReturnasCEO
113,199 views
943 Discussing
5
#KOSPIFalls2.59%ToLowestCloseSinceFebruary
28,432 views
306 Discussing
6
#AnthropicClearedToListOnNasdaqAsANT
25,429 views
264 Discussing
7
#WhatInvestmentSignalsDo13FFilingsReveal?
61,941 views
659 Discussing
8
#TetherCapitalMakesStrategicInvestmentInStables
14,108 views
112 Discussing
9
#EvernorthRecords$505MImpairmentOnPreListingXRP
1,725 views
20 Discussing
10
#GoldmanSachsReports$1.22BInEtherETFHoldings
1,271 views
17 Discussing