Bitcoin (BTC) is flashing some of the most serious technical warning signs we’ve seen in a long time. This is not fear-mongering, hype, or emotional trading — this is pure market structure speaking loudly and clearly.
The weekly chart confirms a major bearish reversal, and ignoring it could be extremely costly. If you’re considering buying “the dip,” it’s critical to understand what the chart is actually telling us.
This is a public service announcement:
Extreme caution is warranted.
The Big Picture: A Structural Shift, Not a Pullback
What we’re witnessing is not a healthy correction within a bull trend. The weekly timeframe — the most important timeframe for trend confirmation — is signaling a transition from bullish to bearish market conditions.
Two critical technical developments confirm this shift:
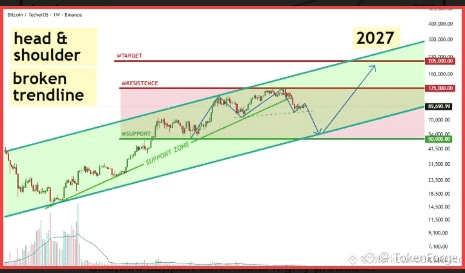
A textbook Head & Shoulders (H&S) reversal pattern
A confirmed break of the long-term uptrend / neckline
These signals demand respect. Markets rarely ignore such clear warnings.
1. Head & Shoulders Pattern: A Classic Bearish Reversal
The Head & Shoulders pattern is one of the most reliable and well-documented reversal formations in technical analysis.
Why This Matters:
It represents distribution, not accumulation
Smart money exits while retail is still hopeful
Once the neckline breaks, downside acceleration is common
Current Status:
Left shoulder: formed during prior highs
Head: final euphoric push
Right shoulder: weaker rally, clear loss of momentum
Neckline: decisively broken
This is not a “maybe” scenario. The breakdown phase is already underway.
2. Broken Trendline: Bullish Momentum Is Gone
The long-standing intermediate support trendline — which also aligns with the H&S neckline — has now been cleanly violated on the weekly chart.
This confirms:
Bulls have lost control
Support has flipped into resistance
Any bounce is likely a dead-cat bounce, not a trend reversal
When a market loses its structural support, price doesn’t stabilize immediately — it searches for deeper, stronger demand zones.
3. Downside Target: $50,000–$54,000 Support Zone
Based on:
The measured move of the H&S pattern
The lower boundary of the long-term price channel
Historical high-volume demand zones
The most probable downside target is the $50,000–$54,000 range
This area represents:
A major psychological level
A long-term structural support
The first zone where meaningful demand might step in
Until this zone is tested, selling pressure and volatility should be expected.
Why Buying Here Is Extremely Risky
Trying to buy Bitcoin at current levels is the definition of catching a falling knife.
Common traps traders fall into:
“It’s already down so much”
“It looks cheap compared to the highs”
“This dip won’t last long”
The chart disagrees.
Markets don’t bottom because price feels cheap —
They bottom when selling is exhausted and structure stabilizes.
Right now, the structure says:
Further downside before any real stability
What Smart Traders Do in This Environment
Protect capital
Stay patient
Let the correction fully play out
Wait for confirmation, not hope
There will be opportunities — after the market proves it has found support.
Final Thoughts: Respect the Chart
Bitcoin doesn’t care about narratives, hype, ETFs, or emotions.
Price follows structure, liquidity, and momentum.
Right now, the weekly chart is screaming one message:
Danger ahead. Proceed with extreme caution.
Don’t let “cheap prices” trick you into risking your capital prematurely. Sometimes, the smartest trade is no trade at all.
Are you holding any coins with similarly ugly charts?
Share them in the comments so we can all stay informed and avoid unnecessary losses.$BTC
