Most investors think the move has already happened. They’re likely wrong.
Because while stocks are rolling over, Bitcoin is doing something far more interesting: It’s hunting its bottom. If you understand this phase of the market cycle, you don’t chase the move—you GET READY for it.
Keying in on several major issues in the markets has been fun recently. Over the past weeks to months, we’ve talked about how Traditional Finance (TradFi) was likely putting in a high-timeframe distribution topping pattern. This was back when the Magnificent Seven were still holding above a major trend.
Now? Everything has made a move LOWER. But here’s the real question: What does this mean for Bitcoin? Because while most traders are focused on what already happened, we’re focused on what’s about to happen. You don’t want to miss this chart setup.
Let’s dive in and start with the KING.
👑 The King: Bitcoin ($BTC )
There are a lot of theories out there right now that Bitcoin has already bottomed. But when we look left, the structural context matters.
Last cycle, Bitcoin bottomed right at the .5 (50%) Fibonacci retrace from low to high on the log scale. That level acted as the final line in the sand before the next major expansion.
Now, this cycle is similar… but not identical. There are a few key factors in play:
First, notice the 2021 double top. That level acted as major resistance for years—until it was finally flipped into support in July 2024. Today, that same level aligns perfectly with the .382 Fibonacci retrace at $56.5K.
That’s a critical zone.
However, we also have to respect what happened in the 2022 bear market. Bitcoin didn’t just drift into a bottom—it broke below the 50EMA, undercut structure, and formed a double bottom pattern (which Steve publicly called in real time).
That detail matters. Because right now, Bitcoin is still holding above the 50EMA. So the question becomes: Is this a shallower bottoming process, or does price still need to sweep lower levels to complete the cycle?
If Bitcoin loses the 50EMA: The next logical move is a test of $56.5K (the .382 level). Level to level.
If we get a deeper flush: Below that sits the more traditional cycle retrace—the .5 level at $44.2K.
👑 Bitcoin/USD (BTC 1M): The Structural Context
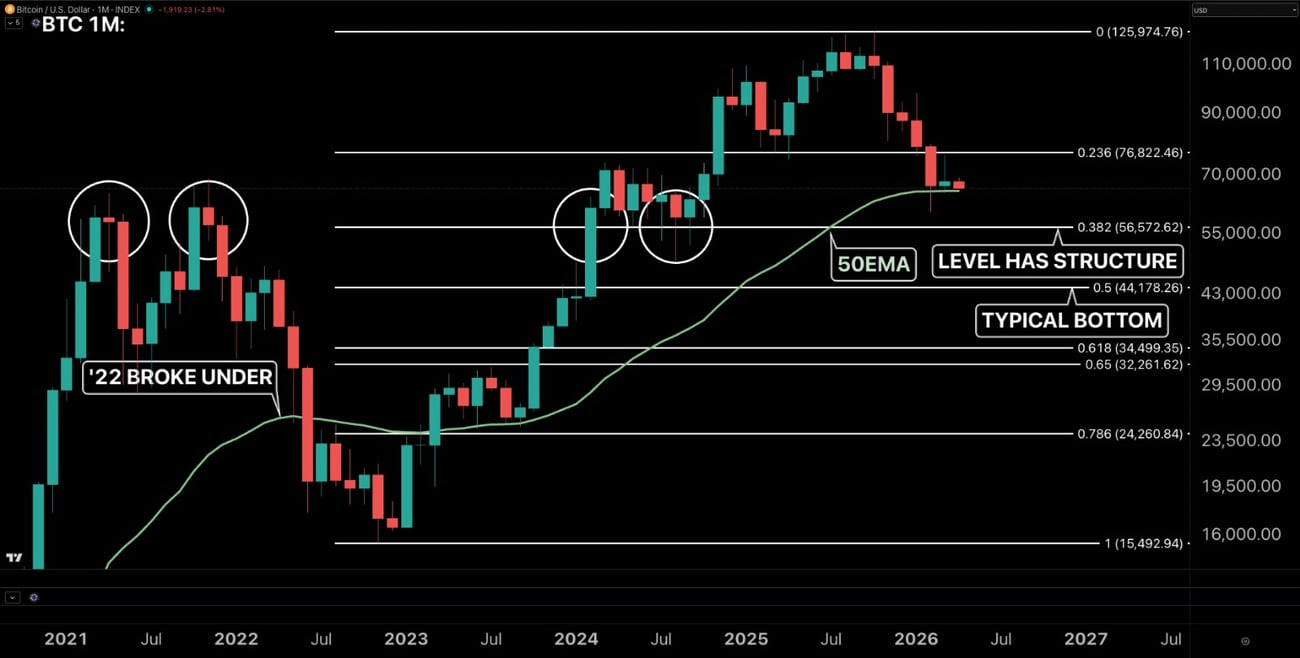
BTC 1 Month chart.
One question kept coming up: "How low can Bitcoin go?" To answer that properly, we need to step outside of crypto for a moment and look at Traditional Finance.
📉 Traditional Finance: The MAG 7 Signal
The Magnificent Seven (MAG 7) refers to the seven largest and most influential tech companies in the market—Apple, Microsoft, Alphabet, Amazon, NVIDIA, Meta, and Tesla. Together, they account for roughly 25%–30% of the total market capitalization of the S&P 500.
In other words, a small group of stocks has been driving a significant portion of overall market performance. That’s the opportunity—and the risk.
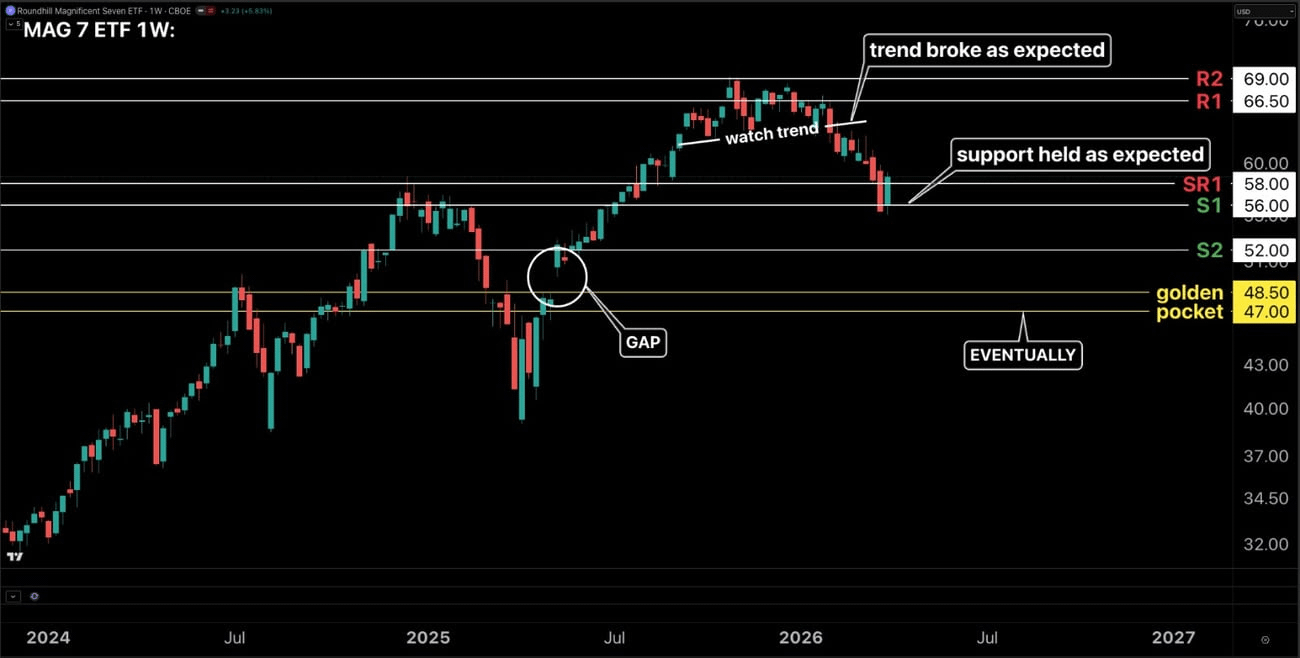
When the MAG 7 pushes higher, it lifts the entire index, including SPX and ES. But when that leadership rolls over, the market doesn’t just drift… it reprices. That’s why weeks ago, the FFA highlighted that the trend was under threat, and that a downside move was likely setting up.
Now here’s where it gets interesting: Bitcoin didn’t wait this time. BTC actually started its move lower first—roughly one month ahead of traditional markets. That’s not random. That’s a signal. You have seen this before. Same horse, different rodeo.
The most probable path from here? A short-term bounce in the MAG 7, followed by a deeper flush that helps complete the broader risk-off move. If that plays out, Bitcoin likely bottoms first—once again leading the broader market by about a month.
A Note on Risk: The golden pocket retrace is probable, but not necessarily a lock. If we get a deeper flush in TradFi, Bitcoin could experience lower levels of support. Why? Forced selling and margin calls in Traditional Markets cause a correlated sell-off across all risk assets.
Men lie. Women lie. But the charts don’t lie.
📉 Magnificent Seven ETF (MAGS 1W): The Market Engine
💠 Ethereum ($ETH)
Alright, enough about Bitcoin for just a moment. Let’s switch to Ethereum.
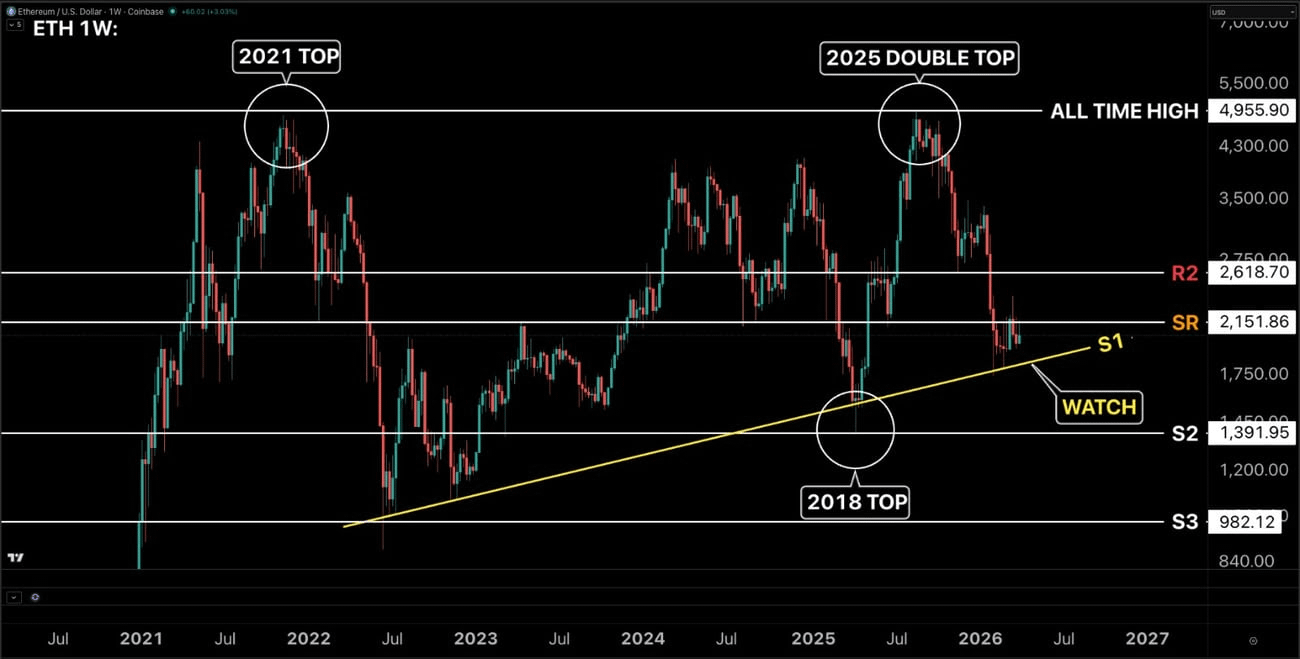
Keep it simple. Watch the macro trend line.
If Ethereum can hold that trend: The path of least resistance is higher, eventually reclaiming the SR (Support/Resistance) level around $2,200.
If it fails: Expect a move lower to test S2 near $1,400.
Level to level.
This is where the domino effect comes into play. If Traditional Finance avoids a deep, prolonged bear market low, the probability increases that both Bitcoin and Ethereum form shallower bottoms. If not, deeper tests remain fully on the table.
Levels matter. The market can get complex, but your approach doesn’t have to. In environments like this, simple wins.
💠 Ethereum/USD (ETH 1W): The Domino Effect
💵 The Silent Winner: USDT.D
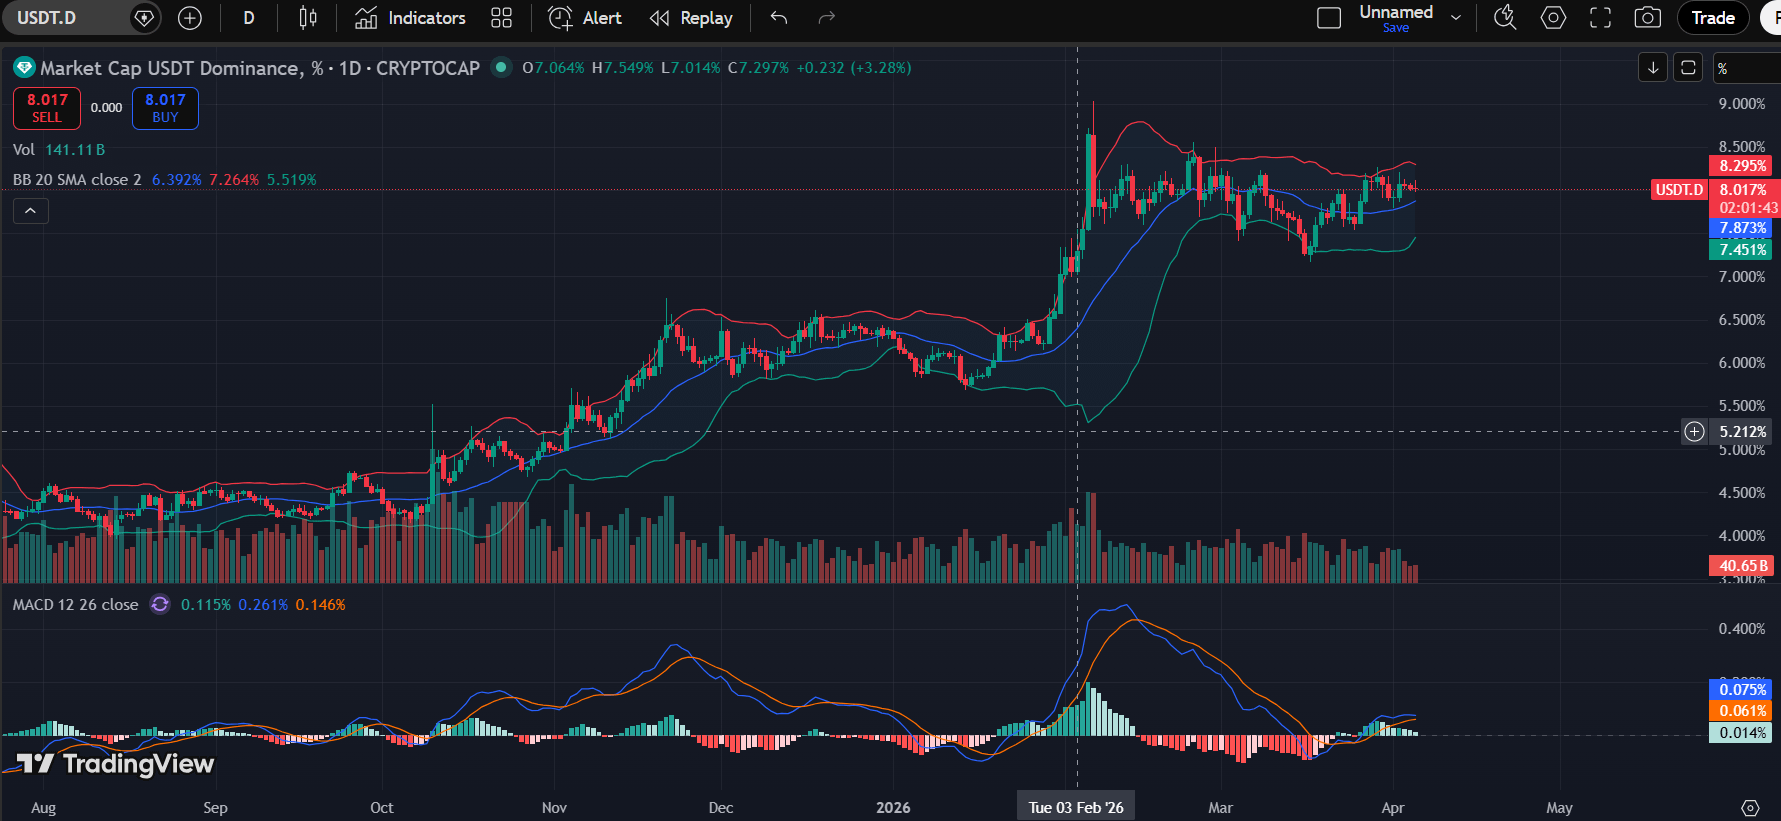
Let’s take it to another level and look at USDT Dominance (USDT.D). This setup looks incredibly clean.
One of the real winners in crypto right now? Stablecoins. Yeah, I know. It's not exactly the headline you want to read. But the reality is, stablecoins are quietly becoming a major piece of mainstream finance.
Exciting? Right? Depends on how you look at it.
This is where things get real. Inside the FFA, we’re not chasing hype. We’re reading the structure like a book. Level to level.
The market is setting up something massive right now—and most people won’t recognize it until it’s already moved.
Stay focused. Stay patient. Stay disciplined.