
$61,500 and $BTC —are you brave enough to bottom-fish?
First, look at the surface: good news and bad news are fighting, but the price is going up.
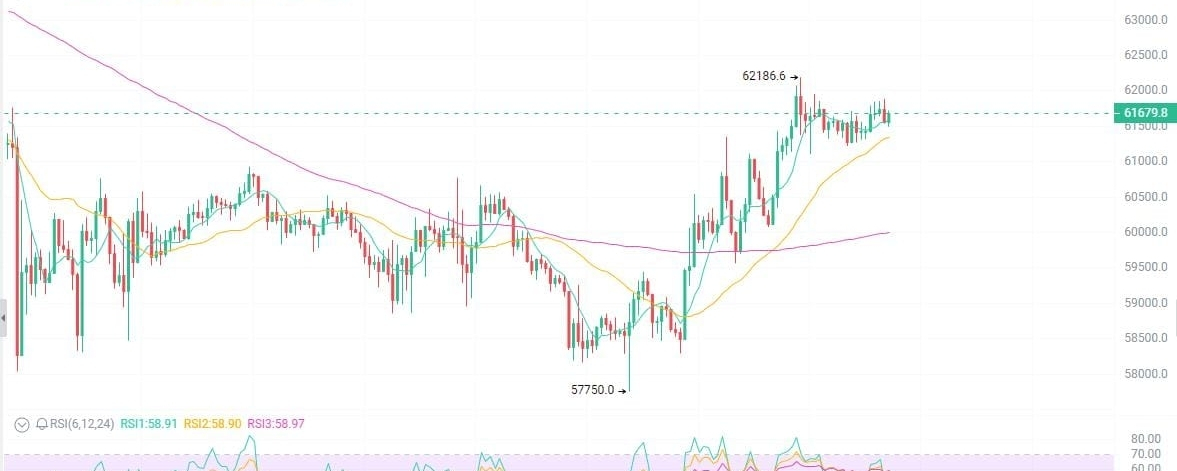
In the past week it rose 3%. At the start of July, it shot up from 58k to 62k+. The candlesticks tell you this: at the 61k level, the previous four times couldn’t hold—now it’s come back again.
All the groups are spamming “The bull market is back,” but old hands glanced at the weekly chart and their hands started to shake.
First thing: Trump made $1.4 billion—but it has nothing to do with you.
The former president disclosed that his 2025 crypto gains were at least $1.4 billion, and he went all-in on a pro-crypto narrative—so market sentiment was definitely boosted.
But if Trump made $1.4 billion, what does that have to do with your account recovering?
Big shots calling orders, retail rushing in to become the bag-holders—while whales slowly distribute at high levels. This script has been played in the crypto market for ten years. Every time, someone falls for it.
Second thing: ETF flows are going out and then coming in—who is lying?
On July 1, there was a daily outflow of $200–300 million, led by BlackRock’s IBIT.
On July 2, there was a daily inflow of $200 million, and the bulls cheered “It’s reversed.”
Add them up over two days: net outflow is still $100 million.
What are institutions doing? Rebalancing—not bottom-fishing.
Look at June overall: ETFs kept seeing net outflows. That trend hasn’t changed.
Daily inflows are like a bounce signal in a bear market—feels good for a moment, then it keeps falling.
Retail sees “$200 million inflow, bull market starting.” Institutions see “Liquidity is good enough—I can offload a bit more.”
Third thing: a dangerous technical signal has appeared.
58k really is strong support, and the rebound to 61k looked great.
Weekly chart: price is still below the 200-day moving average—this is the first time in four years it dropped below and hasn’t reclaimed it.
All the medium-term MAs are pressing down: the 20/50/100/200 EMA are all Sell signals.
Lower highs + lower lows—this structure hasn’t changed.
This isn’t a trend reversal. It’s a bear-market rebound.
Key levels
Resistance above: 60,700–60,800 → 62,000–63,000 → 65,000
Support below: 59,300 → 58,000 → 56,000
If 62,000 holds, then look at 65,000. If it can’t get above 62,000, drop straight back to 58,000.
For short-term players:
Wait, or try a small long position in the 59.2k–59.5k range with a stop-loss below 58k.
Near 62,000, reduce exposure in batches—don’t get greedy. In a bear-market rebound, taking profit is the whole point.
For medium-term players:
Wait for a real breakout above and acceptance over 63,000, or wait for a pullback to 58k–60k before setting up.
For long-term players:
Dollar-cost averaging is okay, but keep position sizing to 10–20% of total funds.