
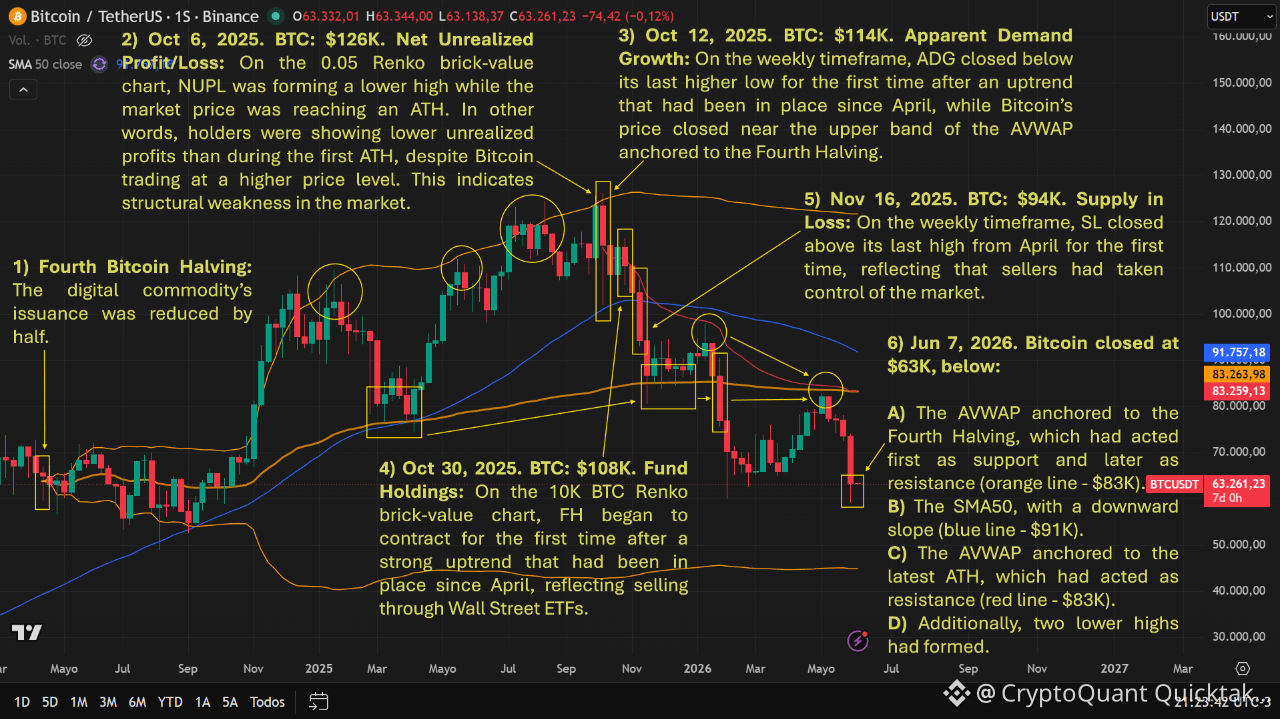
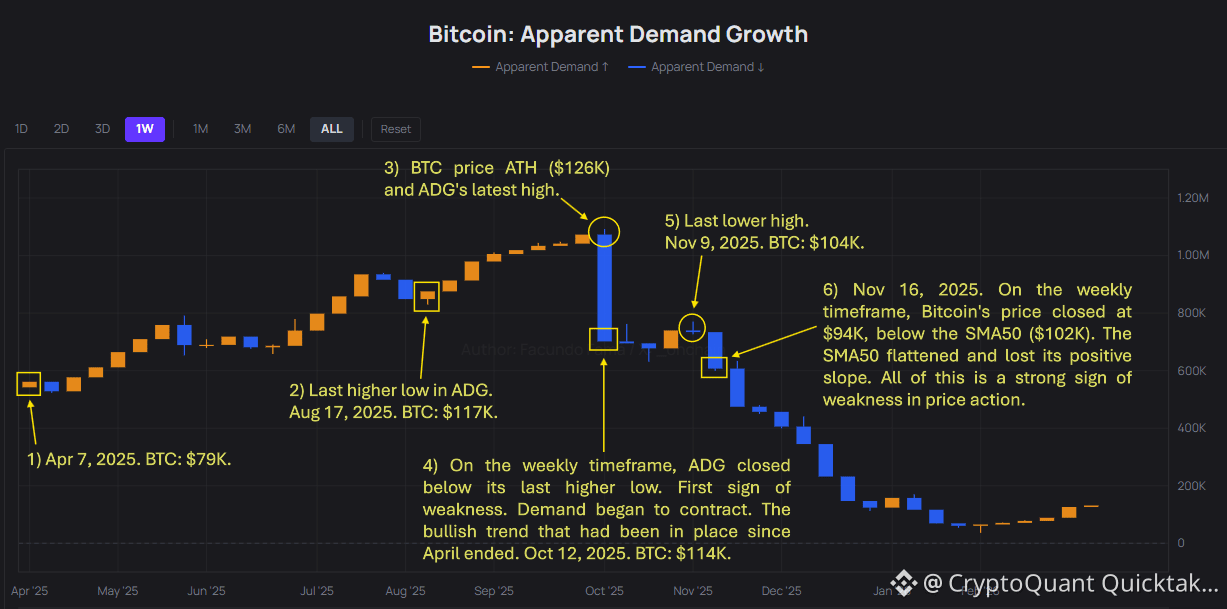
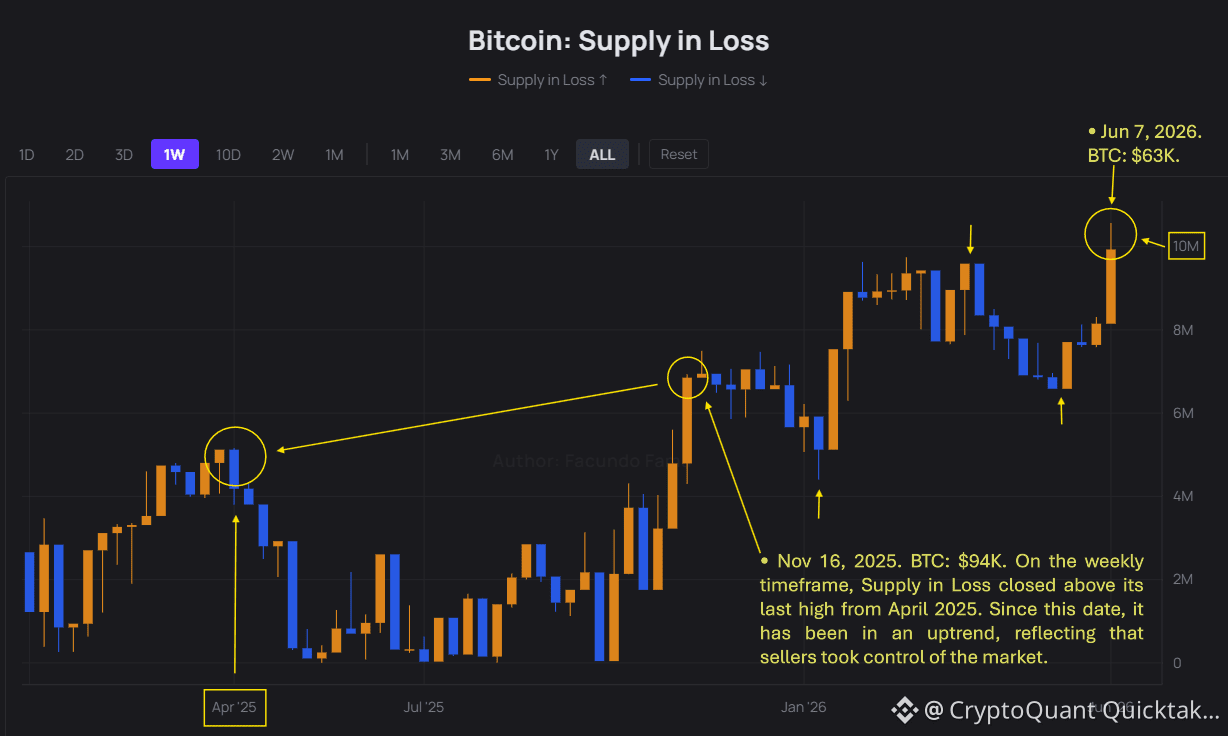
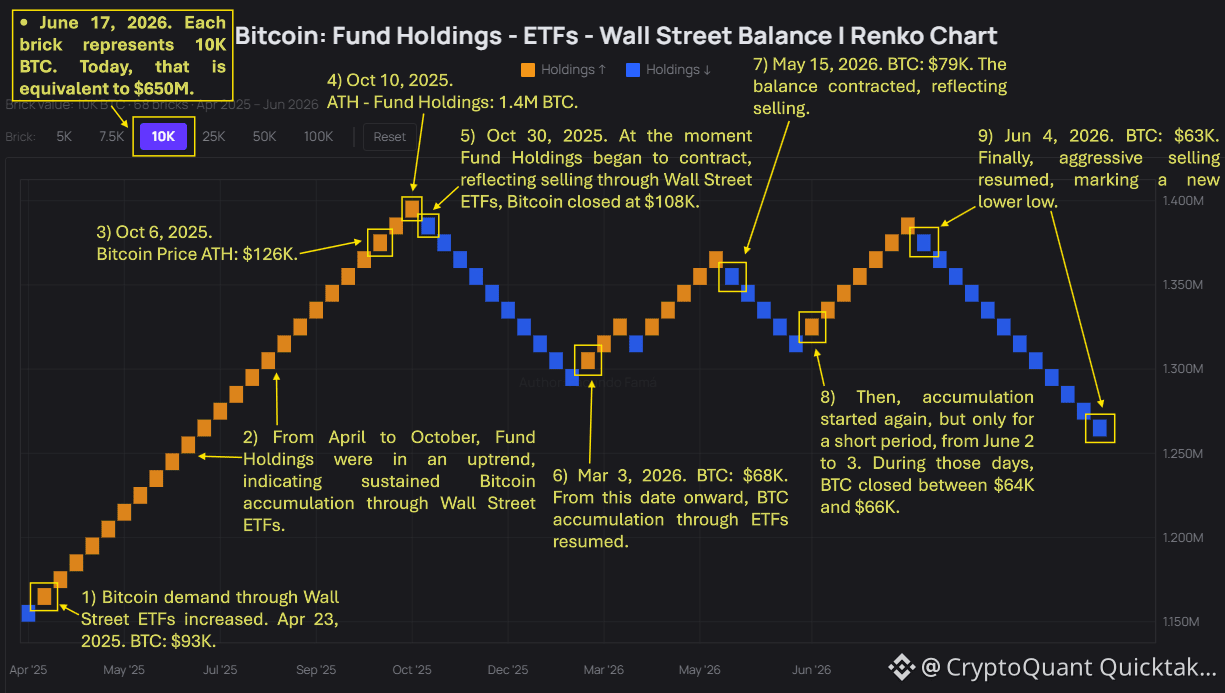
• This chronology shows that Bitcoin’s market deterioration began to appear in on-chain data (supply, demand, and holders) before it fully impacted price. It started with a weakening internal structure between October and November 2025: NUPL formed a lower high while price was reaching a new ATH (BTC: $126K). In other words, holders were showing lower unrealized profits than during the first ATH, despite Bitcoin trading at a higher price level. Then, Apparent Demand Growth broke below its last higher low (BTC: $114K), Fund Holdings began to contract for the first time since April (BTC: $108K), and Supply in Loss broke above its prior high, indicating that sellers took control of the market (BTC: $94K). At the same time this occurred in SL, Bitcoin’s price closed below the SMA50 on the weekly timeframe. Later, the final price decline confirmed the deterioration: at the weekly close of June 7, 2026 (BTC: $63K), the second lower high had fully formed.
• All of this suggests that Bitcoin remains in a bearish macro trend.
• On-chain data extracted from CryptoQuant.
Written by Facundo Fama