Dono crypto ke baadshah aamne-saamne hain. BTC $80K pe hai, ETH $2,280 pe. Lekin price se zyada important hai: trend, tech, aur paisa kahan ja raha hai. Pura sach yahan hai 👇
Based on your ETH chart + current BTC data, here’s the real story 👇1. Price Performance Snapshot - May 2026
Metric Bitcoin (BTC) Ethereum (ETH) Winner
Current Price $80,130 $2,280.64 BTC
ATH $126,198 (2025) $4,956.78 BTC +50% from ATH
Drawdown from ATH -36.5% -54% BTC holding better
YTD 2026 -14% -18% BTC slightly better
Market Cap $1.58T $273B | BTC 5.7x bigger
If BTC breaks $100K, money rotates to ETH. Your $2,280 entry could hit $4,000+ fast. But you need patience. Chart says ETH is lagging, not leading.
Verdict: BTC is winning the "hold value" game in this correction.
---
2. Chart Structure Comparison - 1M Timeframe
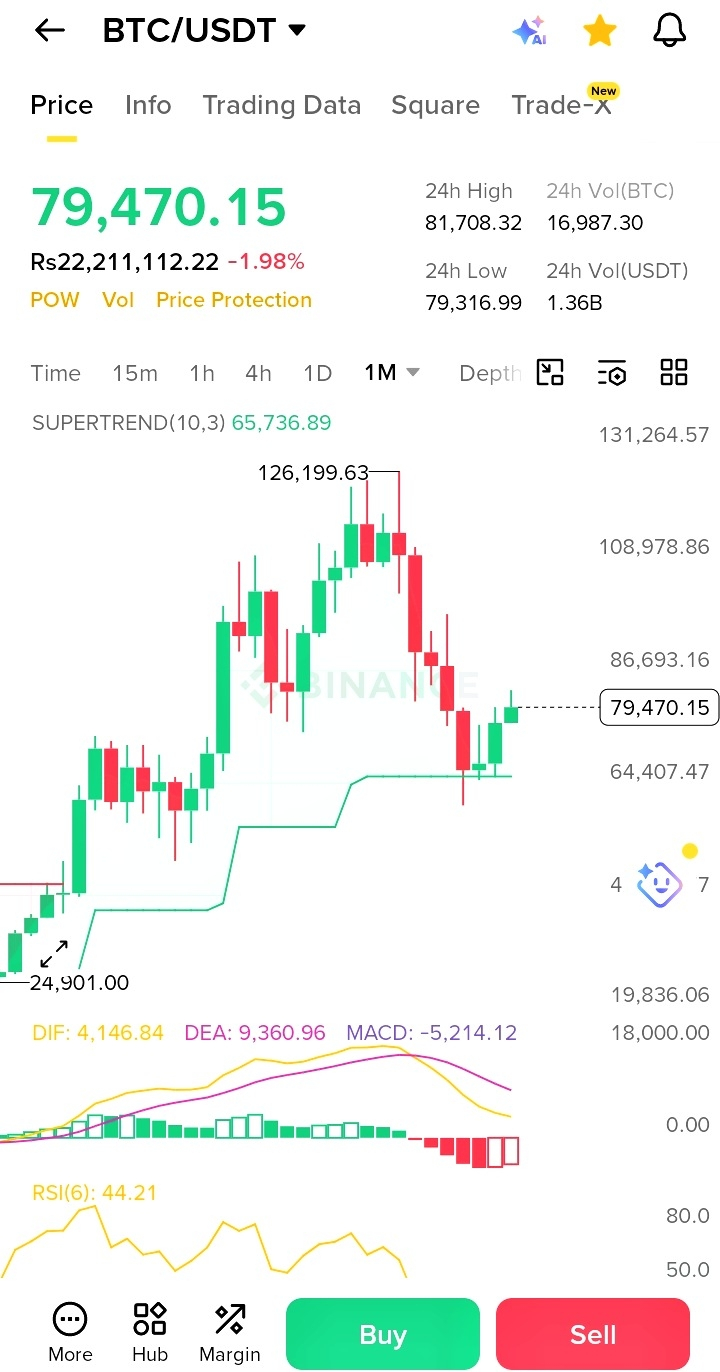
Bitcoin's Chart:
1. Higher Lows: BTC made a low at $15K in 2022, then $25K in 2023. Clear uptrend structure intact.
2. ETF Boost: $2.44B inflow in April 2026 alone. Wall Street buying dips.
3. 200-Day EMA: Testing $82K resistance now. Break = $100K path open.
4. Halving Effect: April 2024 halving. History says 12-18 months after = new ATH.
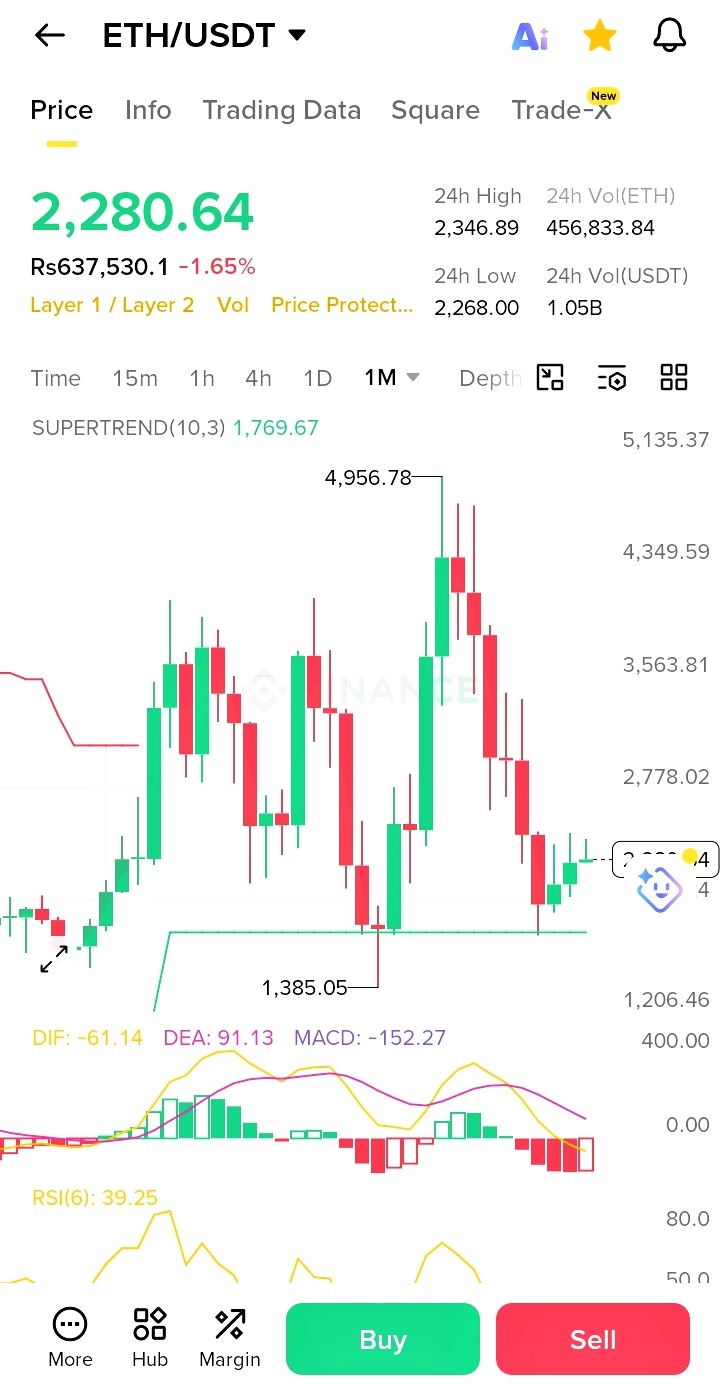
Ethereum's Chart (Your Screenshot):
1. Lower Highs: After $4,956 peak, every bounce is weaker. Downtrend still active.
2. Key Support: $1,769 Supertrend level. Broke below $2,778 major support.
3. MACD: -152.27 = Bearish momentum. BTC’s MACD already flipped positive.
4. RSI: 39.25 = Bears control. BTC RSI is 48 - neutral.
Verdict: BTC chart = "correction in uptrend". ETH chart = "still in downtrend".
---
3. Fundamental War: Store of Value vs World Computer
Narrative Digital Gold World Computer + DeFi + NFTs
Supply 21M hard cap, deflationary No cap, but burn mechanism. Slightly deflationary post-merge
Institutional Play "Safe" crypto. Pension funds buy BTC first "Tech" crypto. VCs + developers prefer ETH
2024-2026 Catalyst Spot ETF = $63.7B AUM Dencun upgrade cut L2 fees 90%, but price lagging
Risk Government ban risk SEC says ETH = security? Smart contract bugs
---
4. ETH/BTC Ratio: The Real Battle
This is the chart that matters. ETH/BTC = 0.0284 right now.
History:
- 2021 Peak: 0.088 = 1 BTC = 11.3 ETH
- 2026 Today: 0.0284 = 1 BTC = 35.2 ETH
- ETH lost 67% value vs BTC since 2021
What it means: If you held ETH instead of BTC since 2021, you’re down 67% in BTC terms. Brutal underperformance.
To reverse: ETH needs to break 0.035 ratio with volume. Until then, BTC is king.
-5. Who Should Buy What in May 2026?
Buy BTC if you want:
1. Safety first - Least risky crypto, "boomer coin"
2. ETF exposure - Easiest for institutions to buy
3. Halving bet - 2025-2026 is historically BTC season
Buy ETH if you want:
1. Higher upside - 54% down vs 36% = more room to recover
2. Tech exposure - Bet on DeFi, NFTs, Layer 2s coming back
3. Staking yield - 3-4% APY if you stake, BTC gives 0%
My take: 70% BTC, 30% ETH until ETH/BTC ratio breaks 0.035. Don’t fight the trend.
6. Bottom Line - The Verdict
Winner Today: Bitcoin ✅
#BTC #VS #ETH #BitcoinDunyamiz #ETHETFsApproved


