
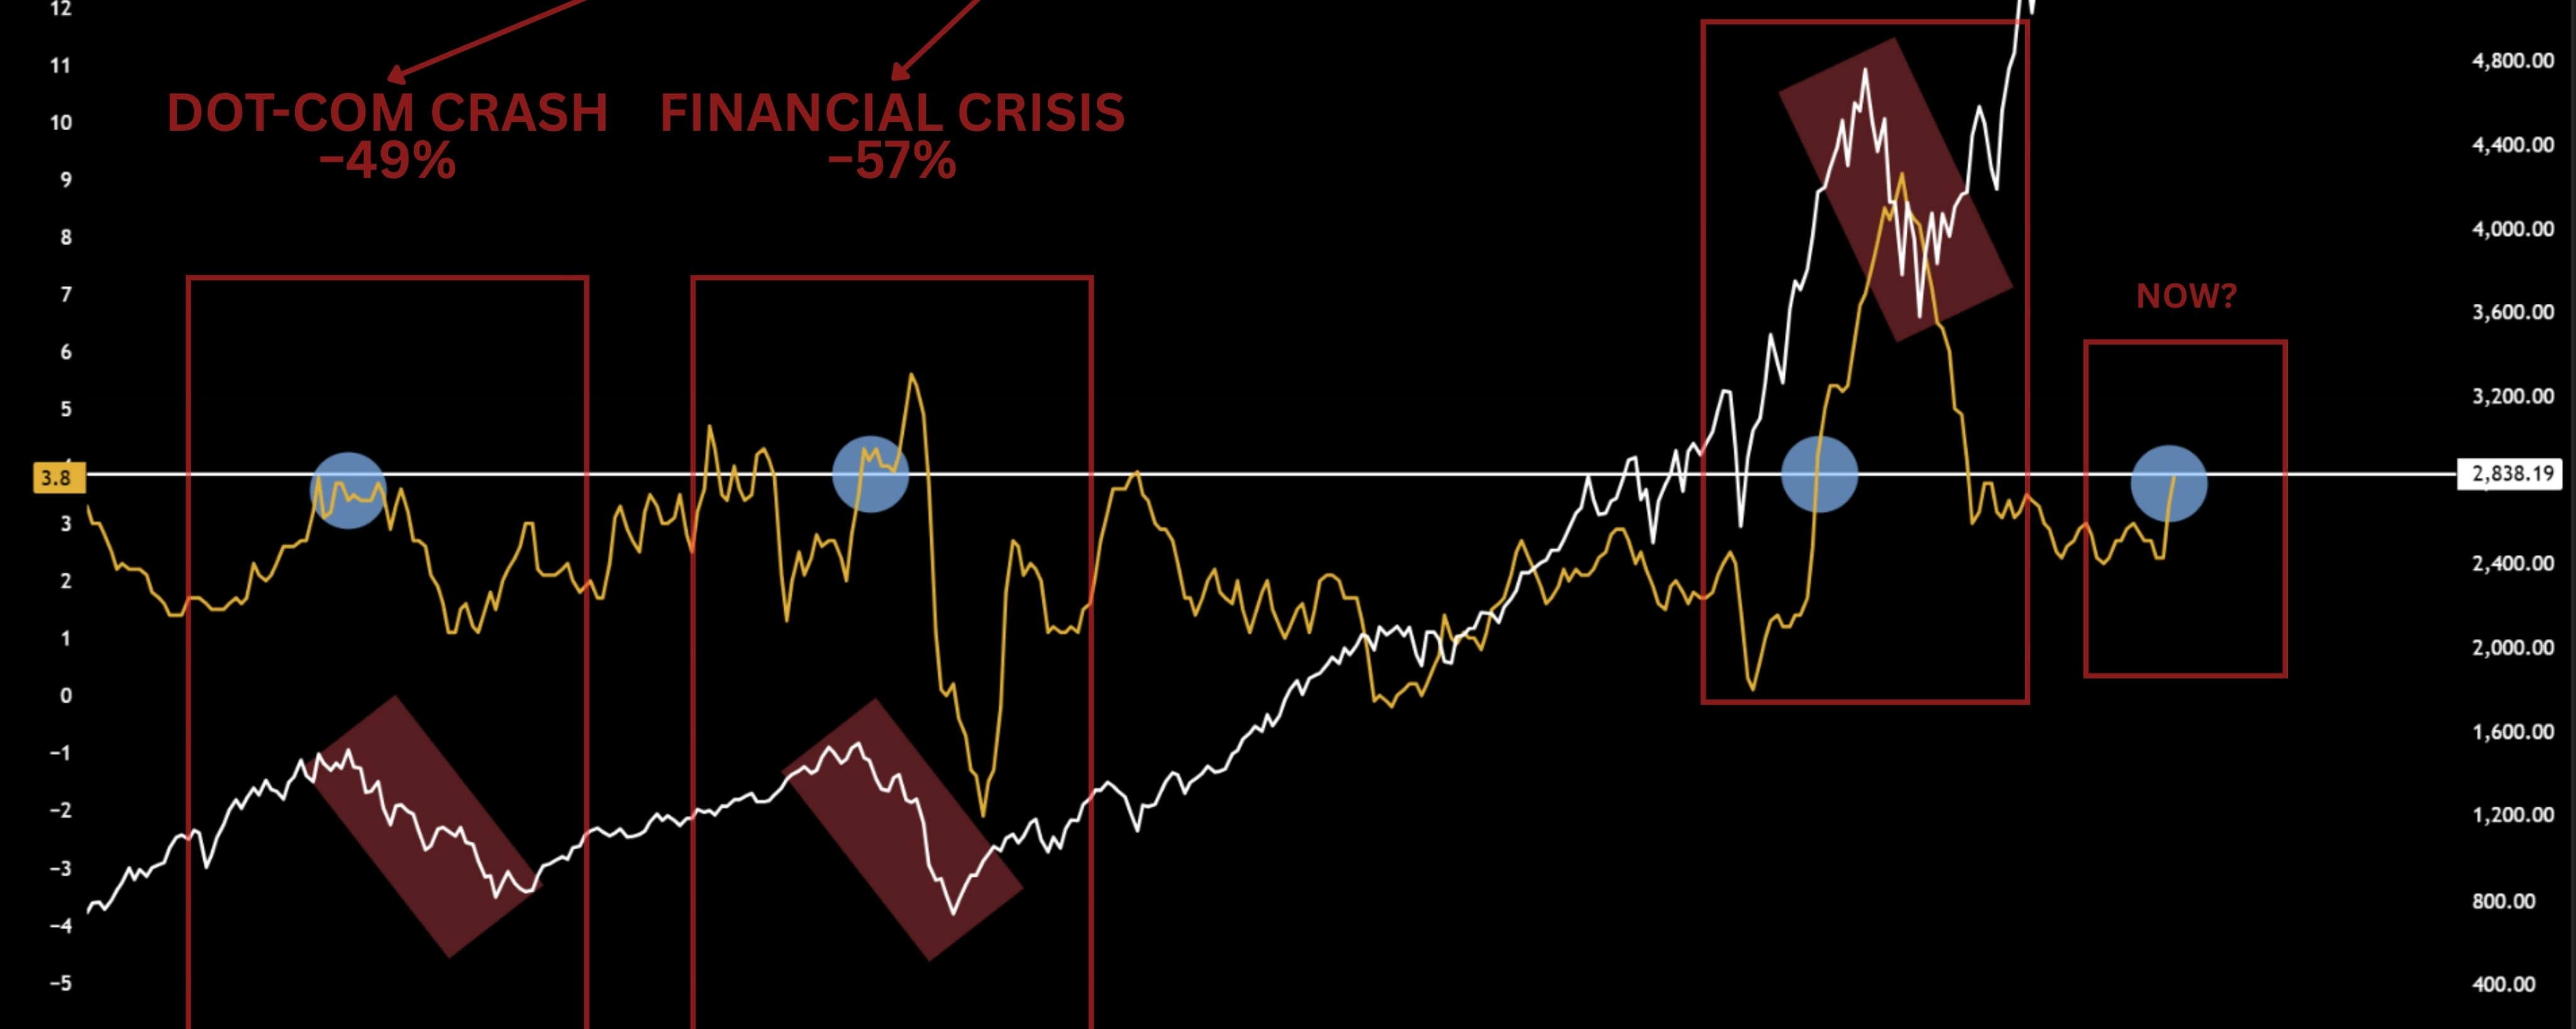

The last 3 major market crashes had one thing in common, inflation above 3.8%.
This is not a coincidence or a pattern someone cherry picked. It has happened six times in the last 55 years.
Every single time inflation crossed that threshold, the S&P 500 entered a bear market or a severe correction.
The dot-com crash: −49%.
The 2008 financial crisis: −57%.
The 2022 rate hike selloff: −25%.
The mechanism is always the same. When inflation crosses 4%, the Fed has no choice but to keep rates high or raise them. Higher rates increase the discount rate on every stock in the market, which automatically compresses valuations.
They also raise borrowing costs for companies, squeeze consumer spending, and raise the probability of a recession. Every one of those things hits stock prices.
Right now US CPI just came in at 3.8% for April 2026, the highest reading since May 2023 and it is accelerating, not slowing down.
The ISM Manufacturing Prices Paid index, which leads consumer inflation by roughly 6 months, just hit 84.6, its highest reading since April 2022, when CPI was running at 8.3%. In the last three months alone it has risen 25.6 percentage points, the fastest acceleration since the 2021 supply shock.
This indicator has historically told you where CPI is going before it gets there.
Energy prices are up 17.9% year over year and account for over 40% of the monthly CPI increase. The Iran conflict pushed oil from $65 last year to the low $80s, with brief spikes toward $120 when Strait of Hormuz closure risk was priced in.
The Strait carries one-fifth of global oil and LNG supply. Goldman Sachs estimates the current geopolitical risk premium at $14 per barrel above pre-conflict levels.
Food inflation is still relatively contained at 3.2% year over year. But food production, transportation, and distribution are all energy-intensive. In 2021, energy led and food followed with a 9-12 month lag. That same sequence appears to be playing out right now.
The Federal Reserve is holding rates at 3.50-3.75% with almost no room to move. The March 2026 dot plot shows 7 officials expecting no rate cuts at all in 2026. A Reuters survey of 103 economists found nearly one-third now forecast zero cuts this year. Apollo's chief economist has said explicitly that the Fed is forecasting stagflation, rising inflation and rising unemployment at the same time.
The S&P 500 is sitting near all-time highs while all of this is happening.
Real wages just turned negative for the first time in three years. Wages are up 3.6% while inflation is running at 3.8%. Americans spent 25% more on fuel in March than in February. The purchasing power squeeze has started.
But here is a legitimate counter argument. US energy production is far higher than in the 1970s, shelter inflation is moderating, and inflation expectations remain relatively anchored compared to that era.
A full 1970s repeat requires conditions, a complete Strait of Hormuz closure, a total de-anchoring of expectations, that are not the base case.
But the pattern has repeated six times. CPI is at 3.8% and every leading indicator points higher. The market has not priced this in.