

Bitcoin has been declining for a while now, and the bearish leg is still ongoing.
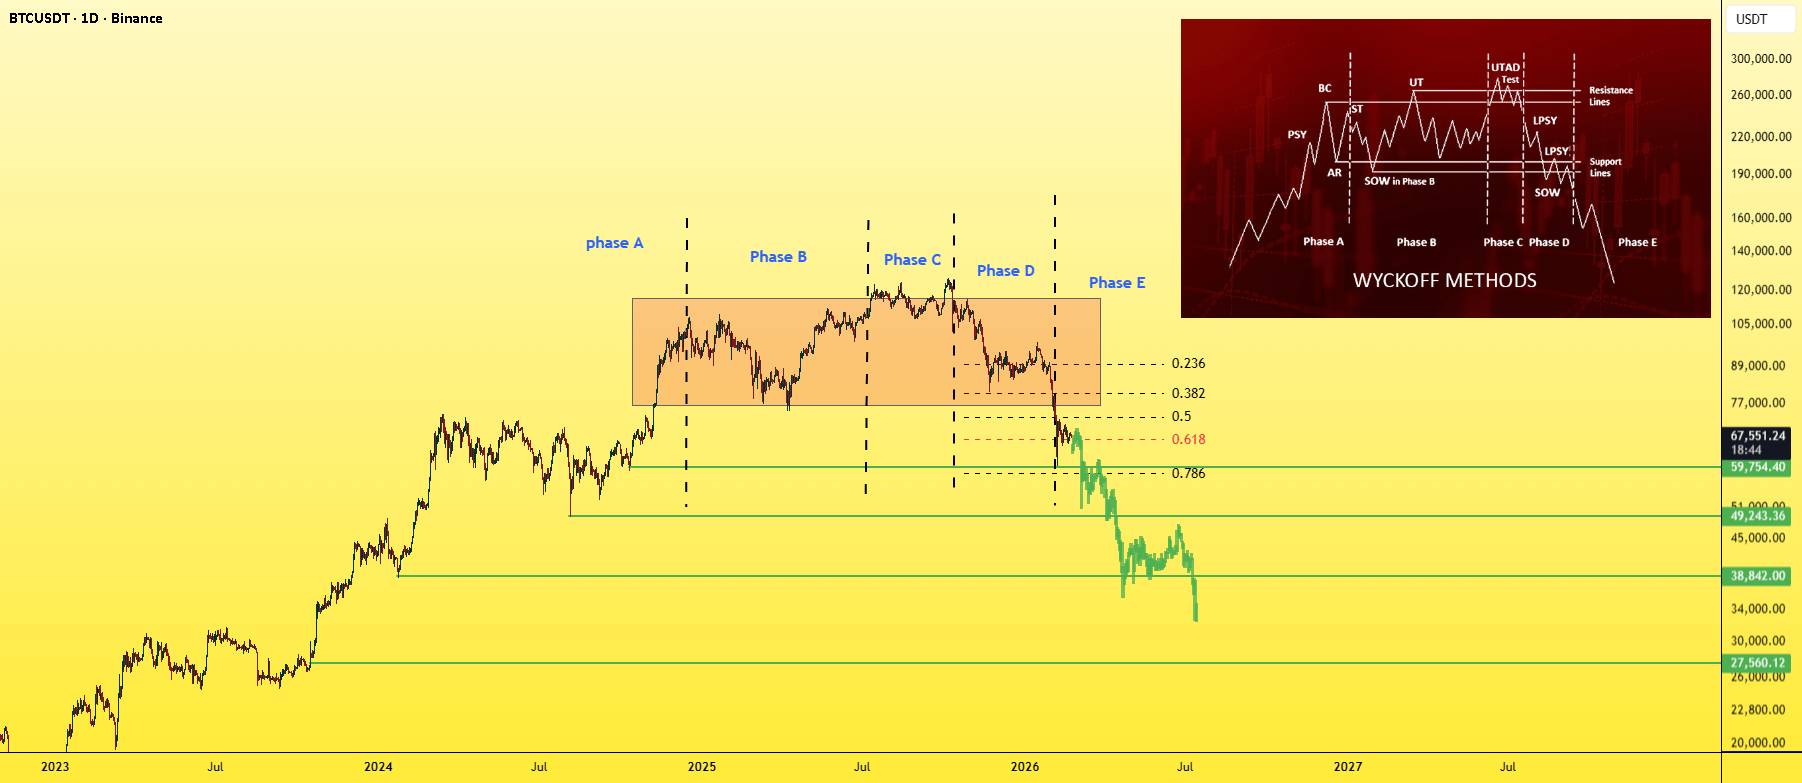
What you’re looking at is a Wyckoff distribution Pattern.
Wyckoff Distribution: is a market structure that forms after a strong uptrend. It represents a phase where institutional money (Smart Money) distributes positions to late retail buyers before a significant decline.
To understand how this plays out , u need to know The Five Phases of Wyckoff Distribution
The Five Phases of Wyckoff Distribution
The structure is divided into five primary phases:
1- Phase A — Stopping the Uptrend
This is where the bullish momentum begins to weaken.
Preliminary Supply (PSY) — Early signs of significant selling pressure
Buying Climax (BC) — A sharp price spike with extremely high volume
Automatic Reaction (AR) — The first strong decline
Secondary Test (ST) — A retest of the highs with weaker demand
At this stage, volatility increases and the trend begins to lose strength.
2- Phase B — Building the Distribution Range
Price moves sideways within a defined range.
During this phase:
Liquidity sweeps occur
False breakouts are common
Volatility continues inside the range
This is often misinterpreted as accumulation, but in reality, it is large players gradually distributing inventory.
3- Phase C — The Upthrust (The Trap)
This is the critical liquidity event.
Price breaks above the range high
Traders enter breakout longs
Liquidity above equal highs is taken
Price quickly reverses back inside the range
This move is called:UTAD (Upthrust After Distribution)
4- Phase D — Beginning of the Breakdown
At this stage:
Lower highs start forming
Range support is broken
Selling volume increases
Market structure shifts from bullish to bearish.
5- Phase E — Markdown Phase
This is the full bearish trend.
Price enters a sustained downtrend, often accelerating rapidly as trapped buyers exit positions.
The illustration I added to the chart is just a schematic of the pattern, and based on the structure, we’re currently in Phase E.
For a proper bottom to form, price needs to sweep the liquidity below — specifically at:
59,700
49,200
38,800
27,500
Each of these zones represents a liquidity pool, and a true bottom doesn’t form unless that liquidity gets taken.
So these levels are, in reality, potential Bitcoin bottom targets.
