The cryptocurrency market remains under pressure as Bitcoin (BTC) struggles to reclaim key resistance near $91,500, with bears attempting to cap upside momentum. According to data from Farside Investors, spot Bitcoin ETFs recorded net outflows of $243.2 million on Tuesday, following strong inflows totaling $1.16 billion during the first two trading days of the year. This shift reflects growing investor caution as BTC trades near elevated price levels.
Despite this, underlying signals remain constructive. On-chain data from Santiment shows that whales have accumulated an additional 56,227 BTC since mid-December, suggesting large holders continue positioning ahead of potential upside. Historically, major market moves tend to follow whale activity, while retail investors often react late.
Adding to the optimistic narrative, Bill Miller IV, Chief Investment Officer at Miller Value Partners, stated on CNBC that Bitcoin appears to be forming a higher base compared to spring 2025, increasing the probability of a breakout toward new all-time highs later this cycle.
The key question now is whether Bitcoin and major altcoins can defend critical support zones and extend the recovery.
Bitcoin (BTC) Technical Analysis
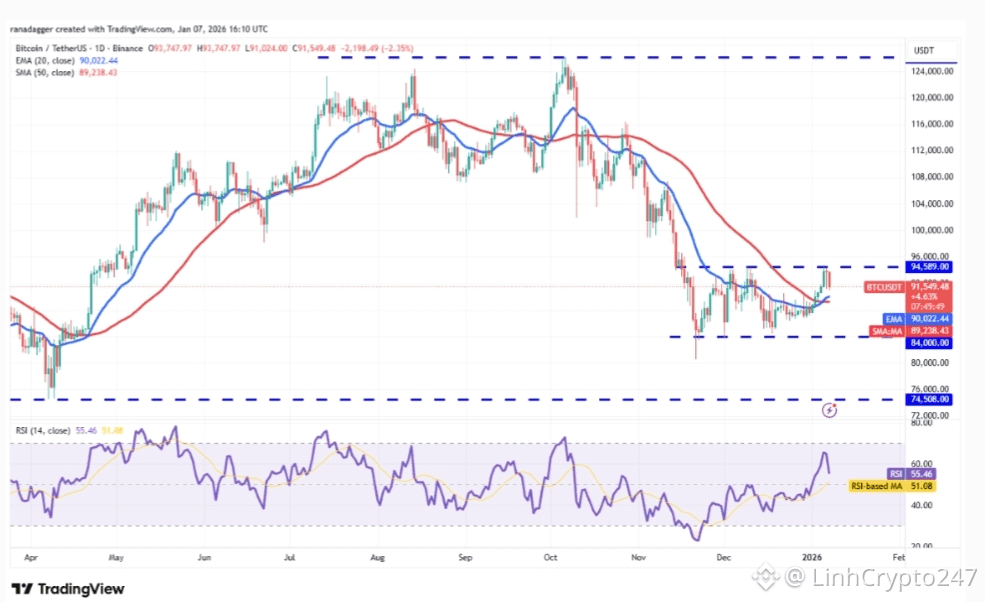
BTC reversed lower from $94,789 on Monday, indicating sustained selling pressure near resistance. The pullback is expected to find support near the 20-day EMA at $90,022. A strong rebound from this level would increase the likelihood of a breakout above $94,589, potentially opening the path toward $100,000, followed by $107,500.
Conversely, a decisive break below the moving averages could keep BTC range-bound. Bears would regain control if price slips below $84,000.
 Ethereum (ETH) Technical Analysis
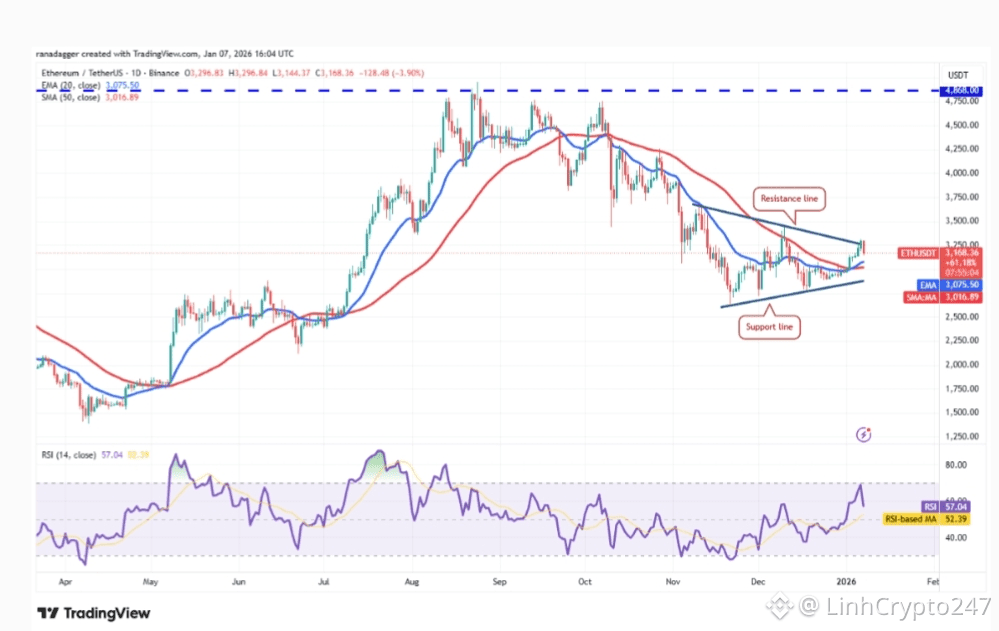
Ether briefly broke above the resistance line of a symmetrical triangle, but bulls failed to sustain higher levels. Price has since slipped back inside the pattern, with support expected near the moving averages.
A rebound could propel ETH/USDT toward $3,659 and later $4,000. However, a breakdown below triangle support would signal a potential bull trap, exposing downside toward $2,623 and $2,111.
 XRP Technical Analysis
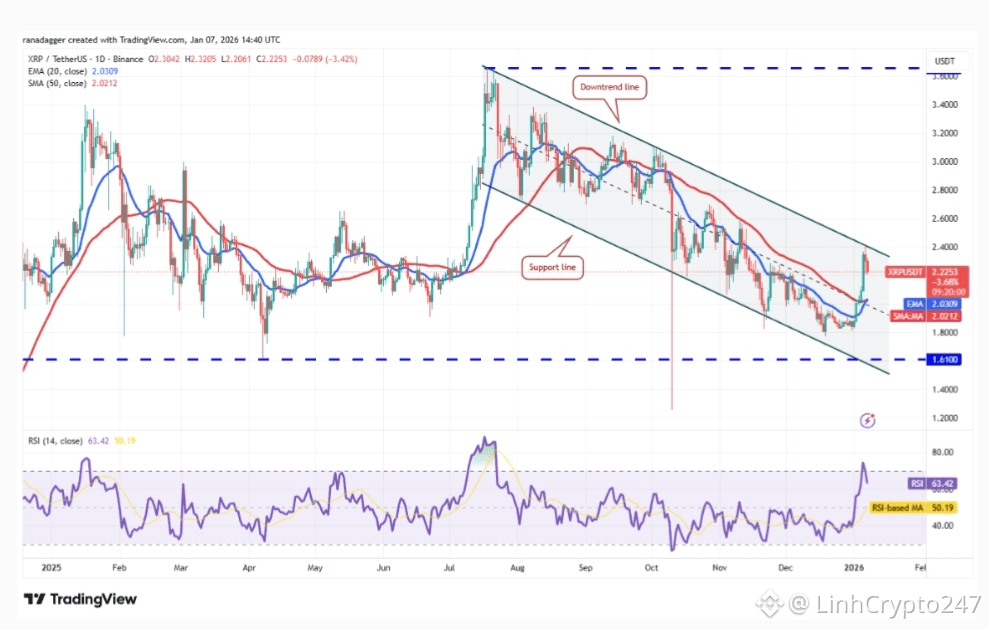
XRP tested the upper boundary of a descending channel, where selling pressure intensified. Moving averages are close to a bullish crossover, and RSI remains in positive territory.
A confirmed close above the channel resistance would signal a short-term trend reversal, with upside toward $2.70. On the downside, failure to hold above the moving averages could keep XRP trading within the channel.
 BNB Technical Analysis
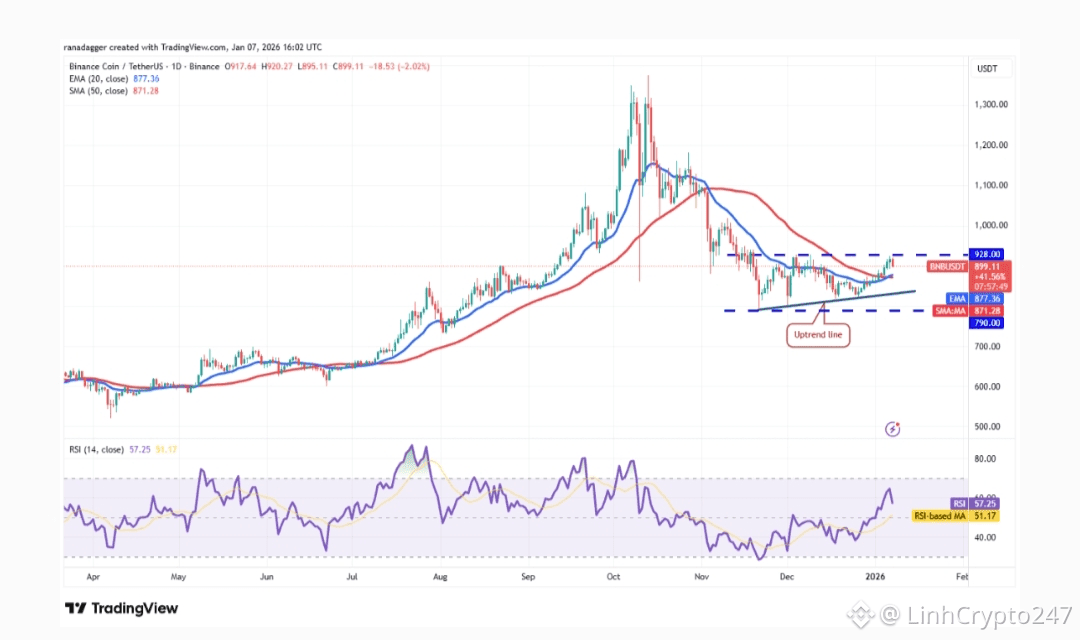
BNB faces resistance near $928, but rising 20-day EMA at $877 and a positive RSI suggest bulls retain control. A daily close above $928 would complete an ascending triangle, with a projected target near $1,066.
If price falls below the moving averages, BNB could remain range-bound between $790 and $928. A break below $790 would favor bears.
 Solana (SOL) Technical Analysis
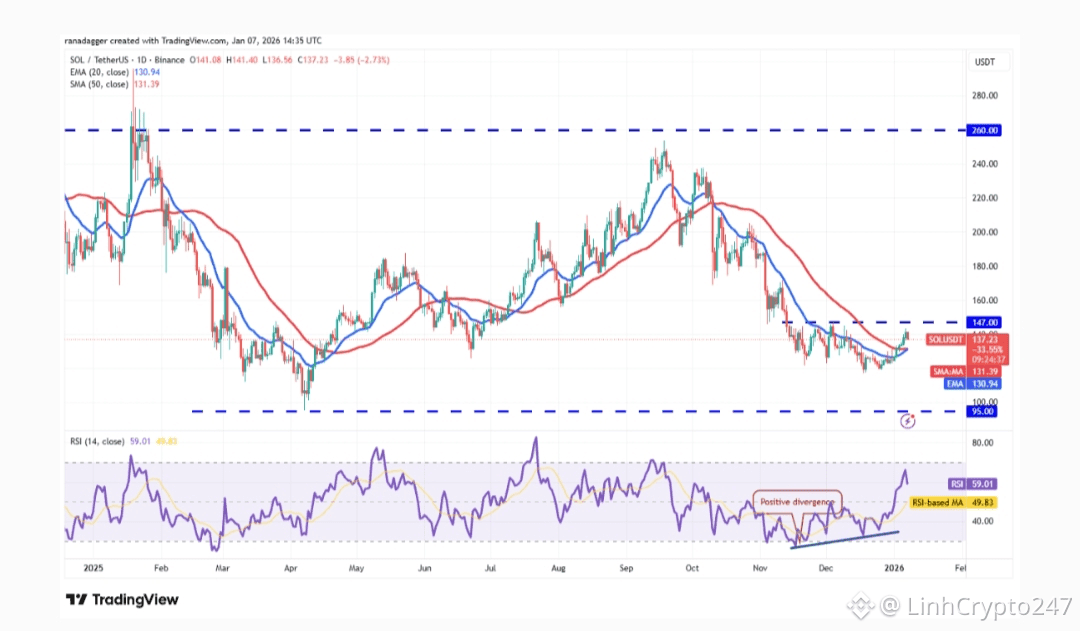
SOL is encountering selling pressure near $147, though bulls have not ceded much ground. A rebound from the moving averages would signal a shift toward buying on dips, increasing the chances of a breakout toward $172.
A break below the moving averages could send SOL toward $116, where strong demand may emerge.
 Dogecoin (DOGE) Technical Analysis
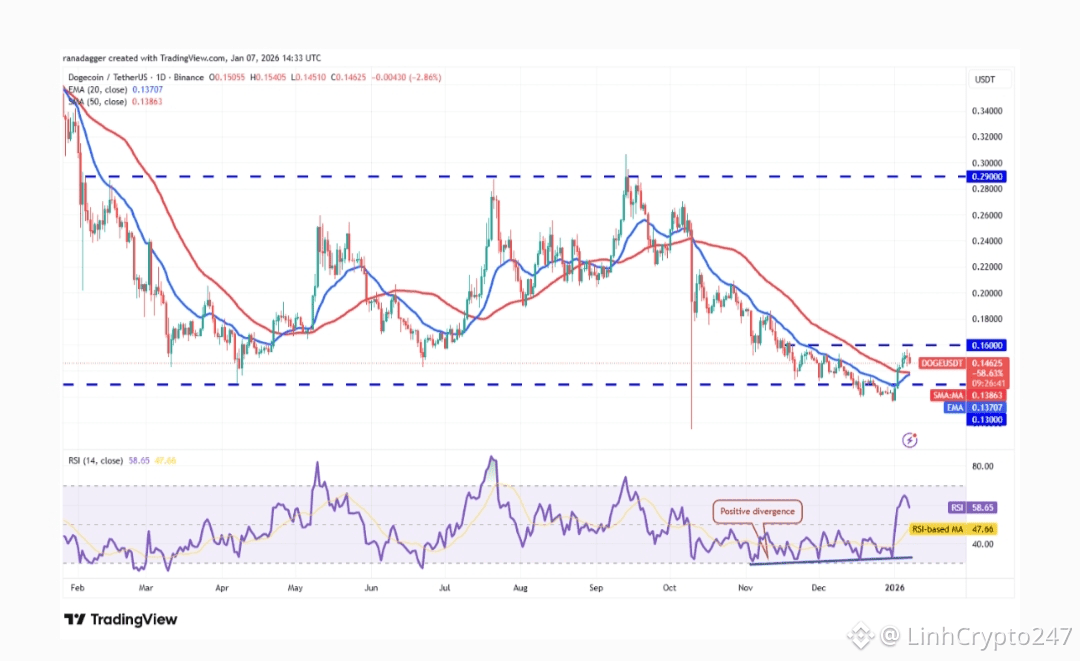
DOGE faces resistance near $0.16, with pullbacks expected to find support near the moving averages. A bounce could push price toward $0.19.
This bullish setup weakens if DOGE falls below the averages, opening downside risk toward $0.13 and $0.11.
 Cardano (ADA) Technical Analysis
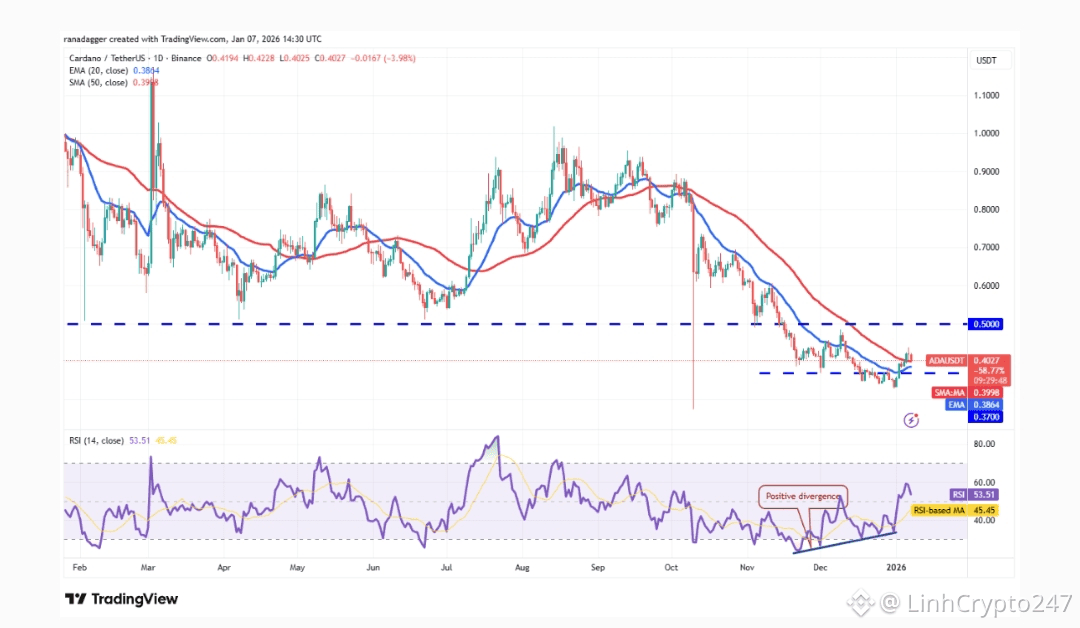
ADA briefly reclaimed the 50-day SMA at $0.40, but failed to hold above it. Bulls are expected to defend the $0.38–$0.37 support zone.
A rebound could send ADA/USDT toward $0.50, while a break below $0.37 increases the risk of a drop to $0.33 and potentially $0.27.
 Bitcoin Cash (BCH) Technical Analysis
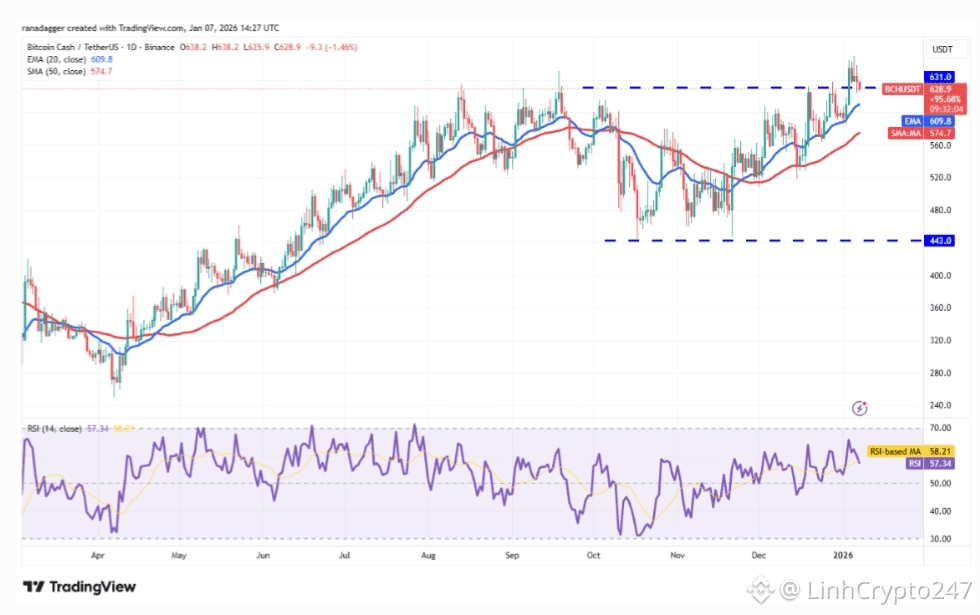
BCH has pulled back to its breakout level near $631, which is likely to act as strong support. A bounce could lift price toward $651 and $720.
A break below the 20-day EMA at $609 would indicate fading momentum, with downside risk toward $518.
 Chainlink (LINK) Technical Analysis
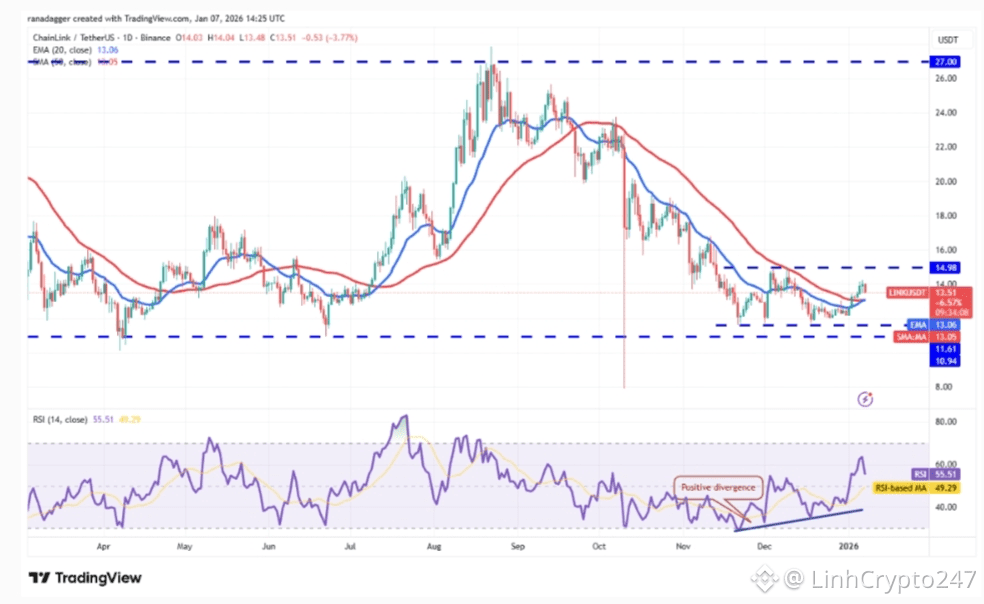
LINK continues to trade in a range between $11.61 and $14.98. A rebound from the moving averages could trigger a breakout above resistance, targeting $16.80 and $17.66.
Failure to hold support would keep LINK range-bound, with a deeper downtrend possible below $10.94.
 Hyperliquid (HYPE) Technical Analysis
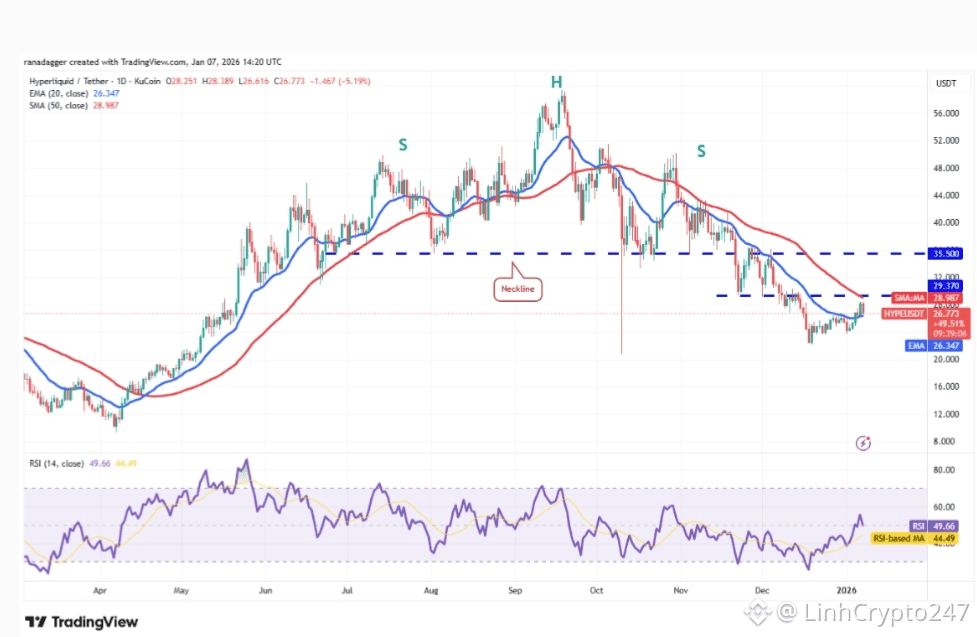
HYPE’s recovery stalled near the 50-day SMA at $29. The 20-day EMA at $26.34 remains key support.
A bounce from this level could fuel a breakout toward $35.50, while a drop below the EMA would expose downside toward $23.64 and $22.19.
 Disclaimer
This article is for informational purposes only and does not constitute financial or investment advice. Cryptocurrency markets are volatile. Readers should conduct their own research and bear full responsibility for their decisions.
👉 Follow for daily crypto market analysis, technical insights, and on-chain updates.


