
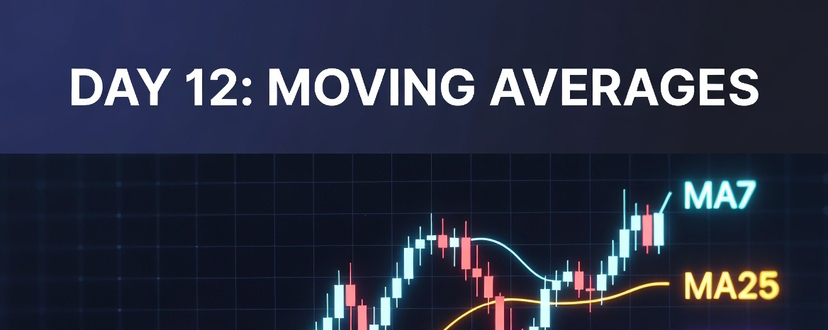


Welcome to the twelfth day of our educational series. Yesterday we learned how to draw horizontal lines to identify key psychological support and resistance zones. Today we are taking a massive leap forward by introducing your very first dynamic technical indicators: Moving Averages. Unlike fixed horizontal lines, moving averages crawl across your chart automatically, smoothing out daily price volatility to reveal the true underlying trend of the market in real time.
What is a Moving Average?
A Moving Average is a foundational calculation used to smooth out price action by filtering out short-term market noise. It constantly updates by calculating the average price of a digital asset over a specific number of previous candlesticks.
For example, if you look at a 1-hour chart, a 7-period moving average adds up the closing prices of the last 7 hours and divides the total by 7. As a new hour begins, the oldest data point is dropped, and the newest candle is added to the calculation. This creates a smooth, flowing line that cuts through market chaos. On our charts, we track three critical moving averages simultaneously: MA7, MA25, and MA99.
The Three Pillars: Short, Medium, and Long-Term Trends
Each of these three lines serves a completely different strategic purpose based on the number of candles it calculates:
* The MA7 Line: This is the short-term trend indicator. Because it only tracks the last 7 candles, it reacts incredibly fast to sudden price movements. It hugs the candlesticks closely, signaling immediate shifts in market momentum.
* The MA25 Line: This represents the medium-term trend floor. It provides a more balanced view, filtering out minor false alarms while remaining responsive enough to capture weekly market swings.
* The MA99 Line: This is the ultimate long-term baseline. Tracking the last 99 candles requires a massive amount of historical data to move. It acts as the ultimate line of defense and defines the macro bull or bear market direction.
How to Use Moving Averages as Dynamic Support and Resistance
While traditional support and resistance lines are drawn manually as flat ceilings and floors, moving averages act as living, breathing boundaries that adjust automatically as new trading data enters the book.
During an aggressive uptrend, the price will frequently ride safely above the MA7 and MA25 lines. When a healthy market correction occurs, the price will often drop down and bounce perfectly off the MA25 or MA99 line. In this scenario, the moving averages act as dynamic floors. Conversely, during a brutal downtrend, the lines sit directly above the candlesticks, acting as a dynamic ceiling that rejects any attempts to rally.
Creator's Advice: Watch for the Moving Average Crossover
One of the most reliable signals for a trend reversal is a moving average crossover. When the fast-moving MA7 line crosses cleanly above the medium-term MA25 line from below, it indicates that short-term buying momentum is accelerating aggressively, often signaling a great entry point. However, if the MA7 crosses below the MA25 line, it signals that immediate selling pressure is taking over, warning you to secure your capital or tighten your stop-losses. Always look at the position of all three lines relative to each other before making a definitive move.
Tomorrow we will elevate our analytical toolkit by introducing the Relative Strength Index, showing you how to spot when an asset is heavily overbought or oversold. For today, your practical homework is to open your spot trading screen, turn on the MA indicator, set the parameters to 7, 25, and 99, and observe how beautifully the price respects these lines during a trend.
#TechnicalAnalysis #MovingAverages #RENDER4MonthHighAIDemand