D1 (Daily) chart for $WAXP
as of March 20, 2026, 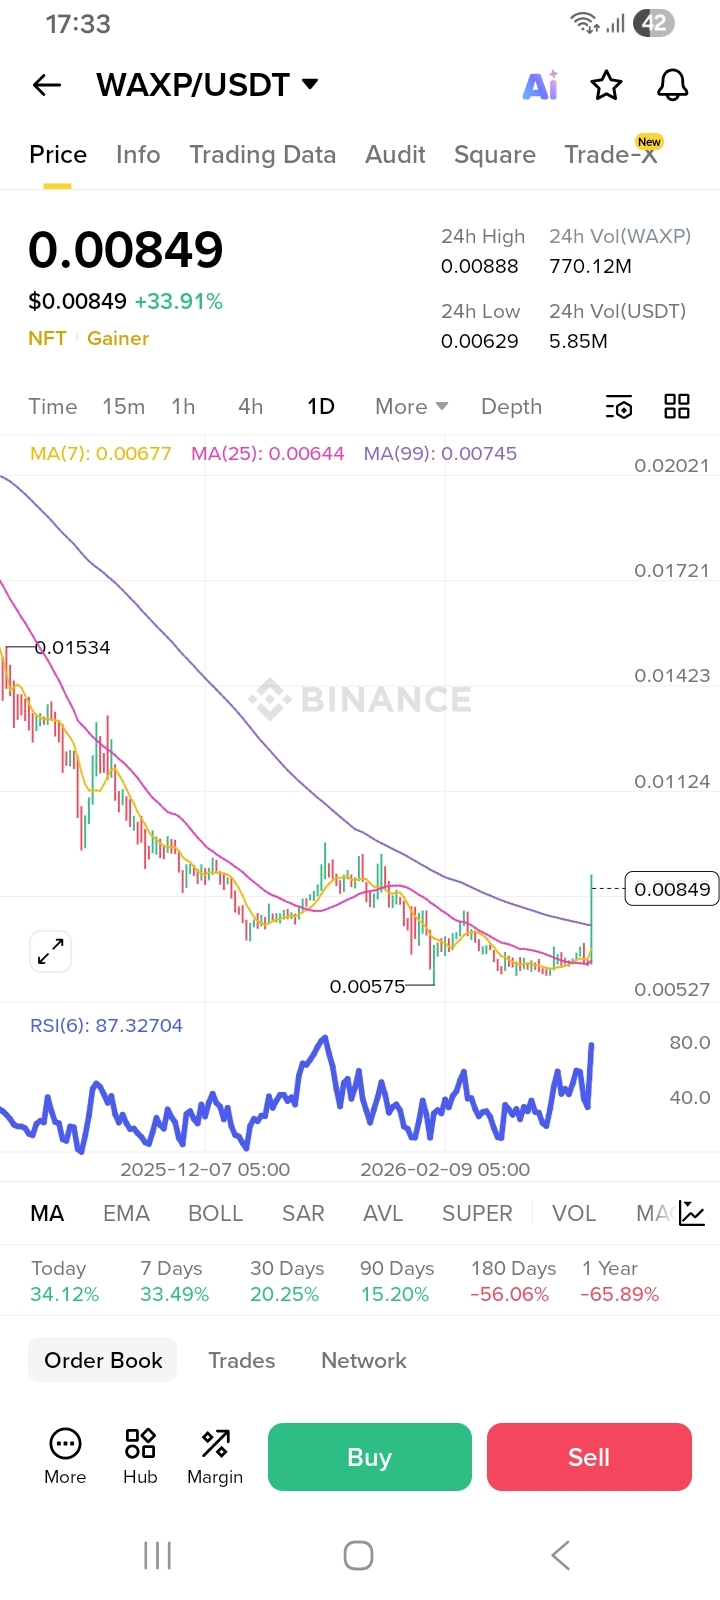
the asset is showing significant short-term volatility with a strong bullish impulse today, though the long-term structure remains in a corrective phase.
Price Action & Key Levels
* Current Price: Approximately $0.00801, marking a sharp +25% increase in the last 24 hours.
* Support Zones: Strong historical support is established around the $0.0058 – $0.0062 range. This area recently acted as a "Double Bottom" floor, sparking the current rally.
* Resistance Zones: The immediate hurdle is the $0.0085 – $0.0095 zone. A sustained break above this is required to shift the Daily trend from bearish to bullish.
Technical Indicators (D1)
| Indicator | Status | Observation |
|---|---|---|
| Moving Averages | Bearish/Neutral | The price is currently testing the Daily SMA50. The 200-Day MA is still sloping downward, suggesting the long-term trend hasn't fully reversed yet. |
| RSI (14) | Neutral (52-57) | Emerging from oversold territory; there is still room for upward movement before hitting the "overbought" (70+) threshold. |
| MACD | Bullish Crossover | The MACD line has crossed above the signal line from below, indicating building upward momentum. |
| Chart Pattern | Falling Wedge | WAXP has been compressing within a large falling wedge. Today’s price action suggests an attempt to break the upper descending resistance line. |
Market Sentiment & Analysis
The sudden surge is likely driven by a "relief rally" after WAXP hit its all-time low (near $0.0058) earlier this year. While the 24-hour volume has spiked significantly (over $60M), the broader Web3 gaming sector remains under pressure, which may limit the sustainability of this pump unless it finds fundamental support.
Short-Term Outlook: If WAXP closes the daily candle above $0.0082, it confirms the double bottom breakout, potentially targeting the $0.010 psychological level. However, failure to hold $0.0075 could result in a retest of the $0.0065 support.