Bitcoin rises above $72,000 as the war in the Middle East continues amid rising Oil prices and stock market instability.
Ethereum eyes a range breakout around $2,150 as institutional interest steadies, with $72 million inflows into spot ETFs.
XRP gains momentum above $1.42 as traders pile into long positions.

Cryptocurrency prices are broadly recovering despite the escalating United States (US)-Iran war. Bitcoin (BTC) has increased to trade above $72,000, reflecting improving sentiment for the crypto asset class. Altcoins, including Ethereum (ETH) and Ripple (XRP), are showing signs of extending their recovery, with ETH hovering above $2,100 and XRP above $1.42.
Bitcoin extends recovery despite US-Iran war tensions
The war in the Middle East has entered its 14th day, with the United States (US) and Israel still striking Iranian targets. Despite the US President Donald Trump saying that the war will end “soon,” a ceasefire seems like a long shot at the moment, especially with Iran intensifying strikes on Gulf countries and paralysing shipments in the Strait of Hormuz.
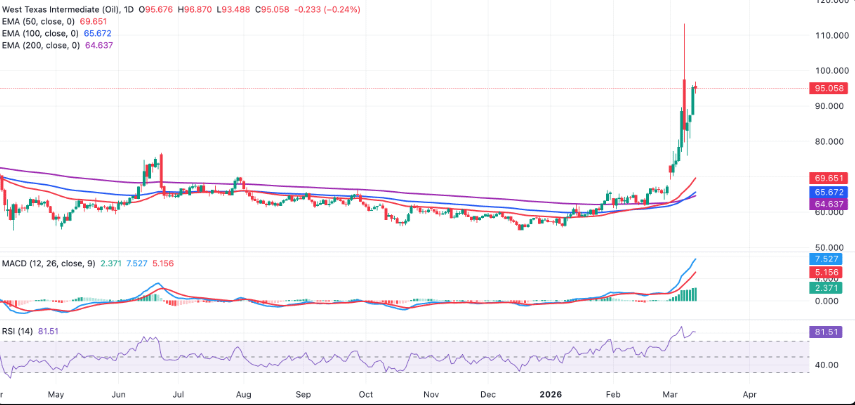
Oil prices keep rising, with the WTI price hitting a daily high of $97 before adjusting to $95 at the time of writing. On Monday, WTI traded at a high of $113 – not seen since June 2022 – and a low of $80, underscoring the impact of the war on Oil prices.
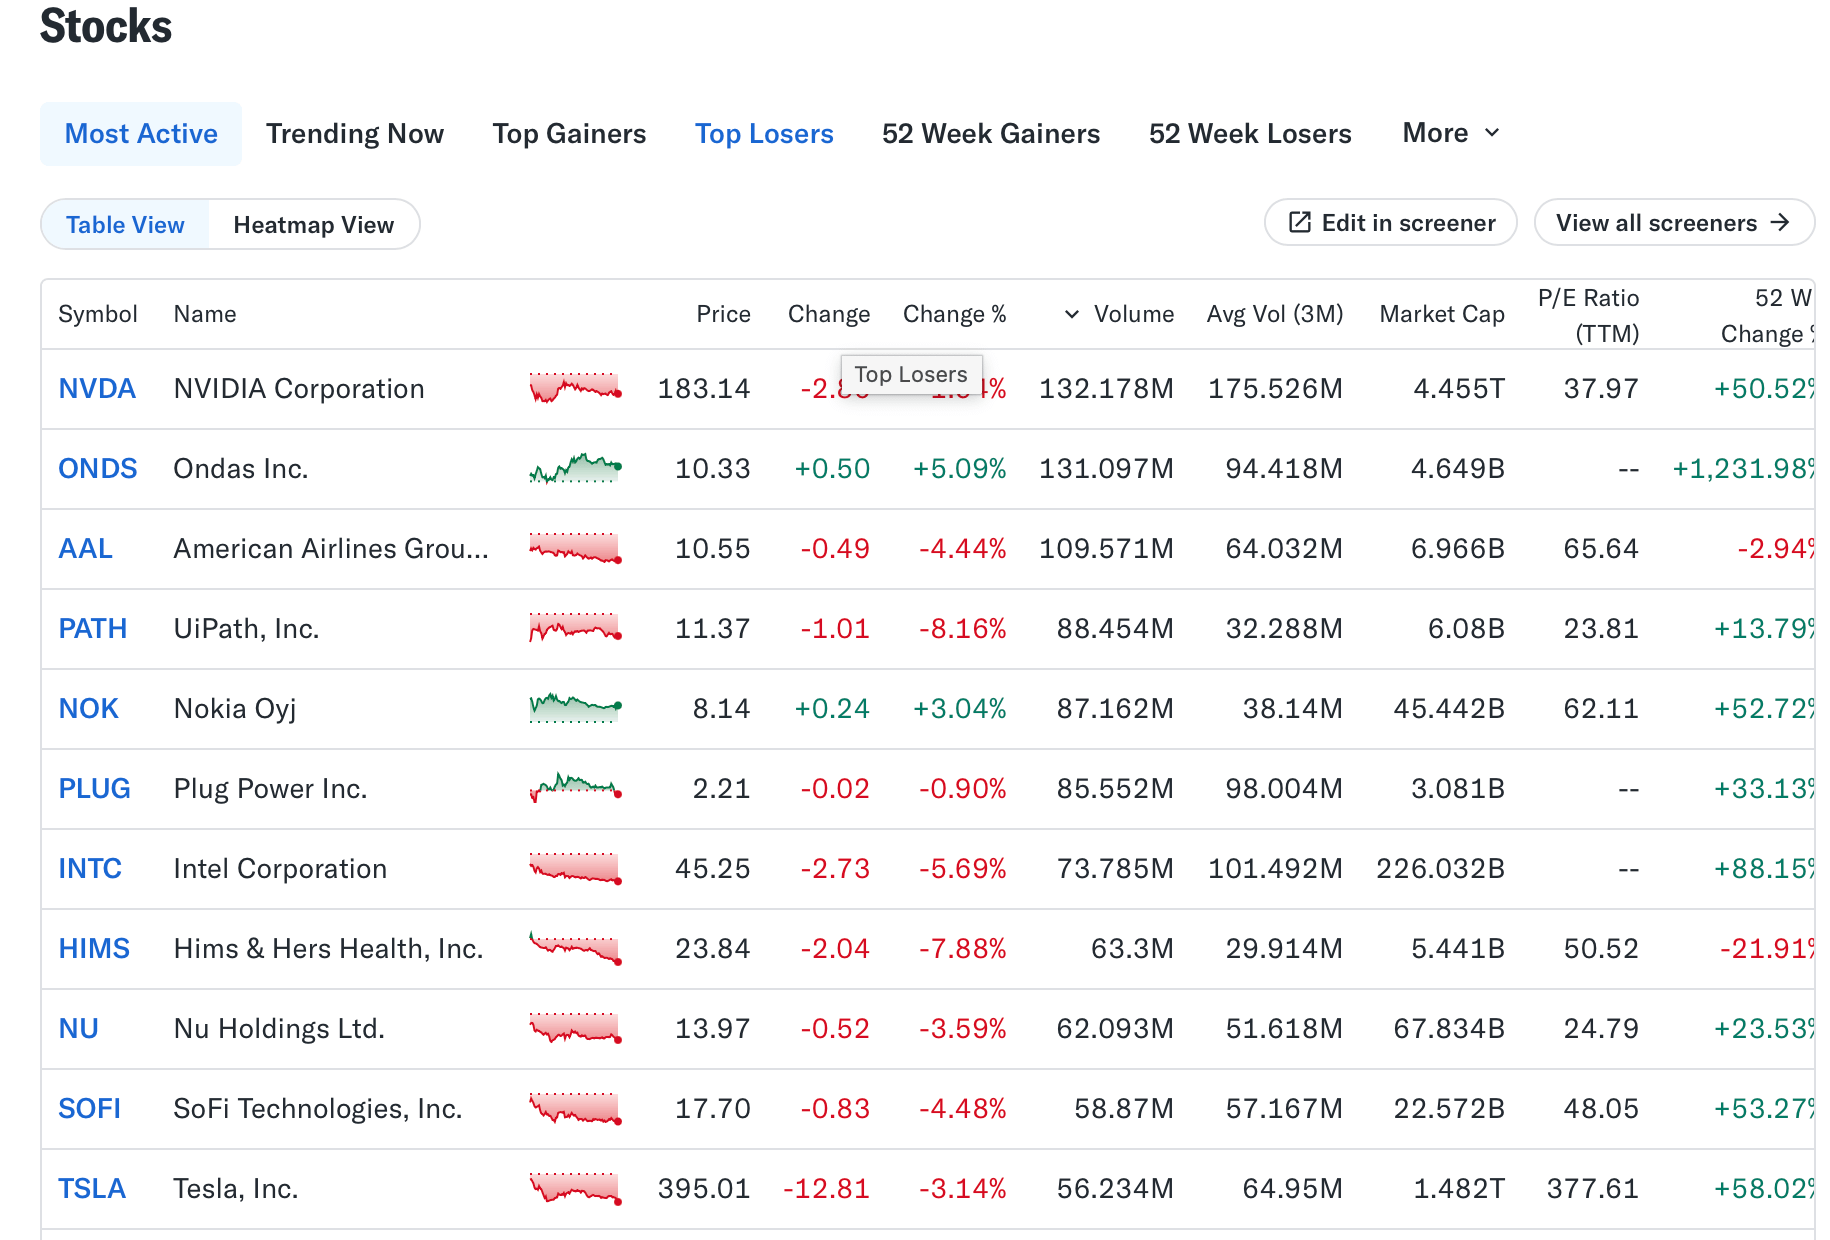
The US stock market remains unstable, with S&P Futures down 0.03% and Dow Futures down 0.12%. Nvidia (NVDA) shares have corrected by 1.54% to $183, American Airlines Group (AAL) by 4.44% to $10.55, Intel Corporation (INTC) by 5.69% to $45.25, and Tesla (TSLA) by 3.14% to $395 on the day, according to Yahoo Finance data.
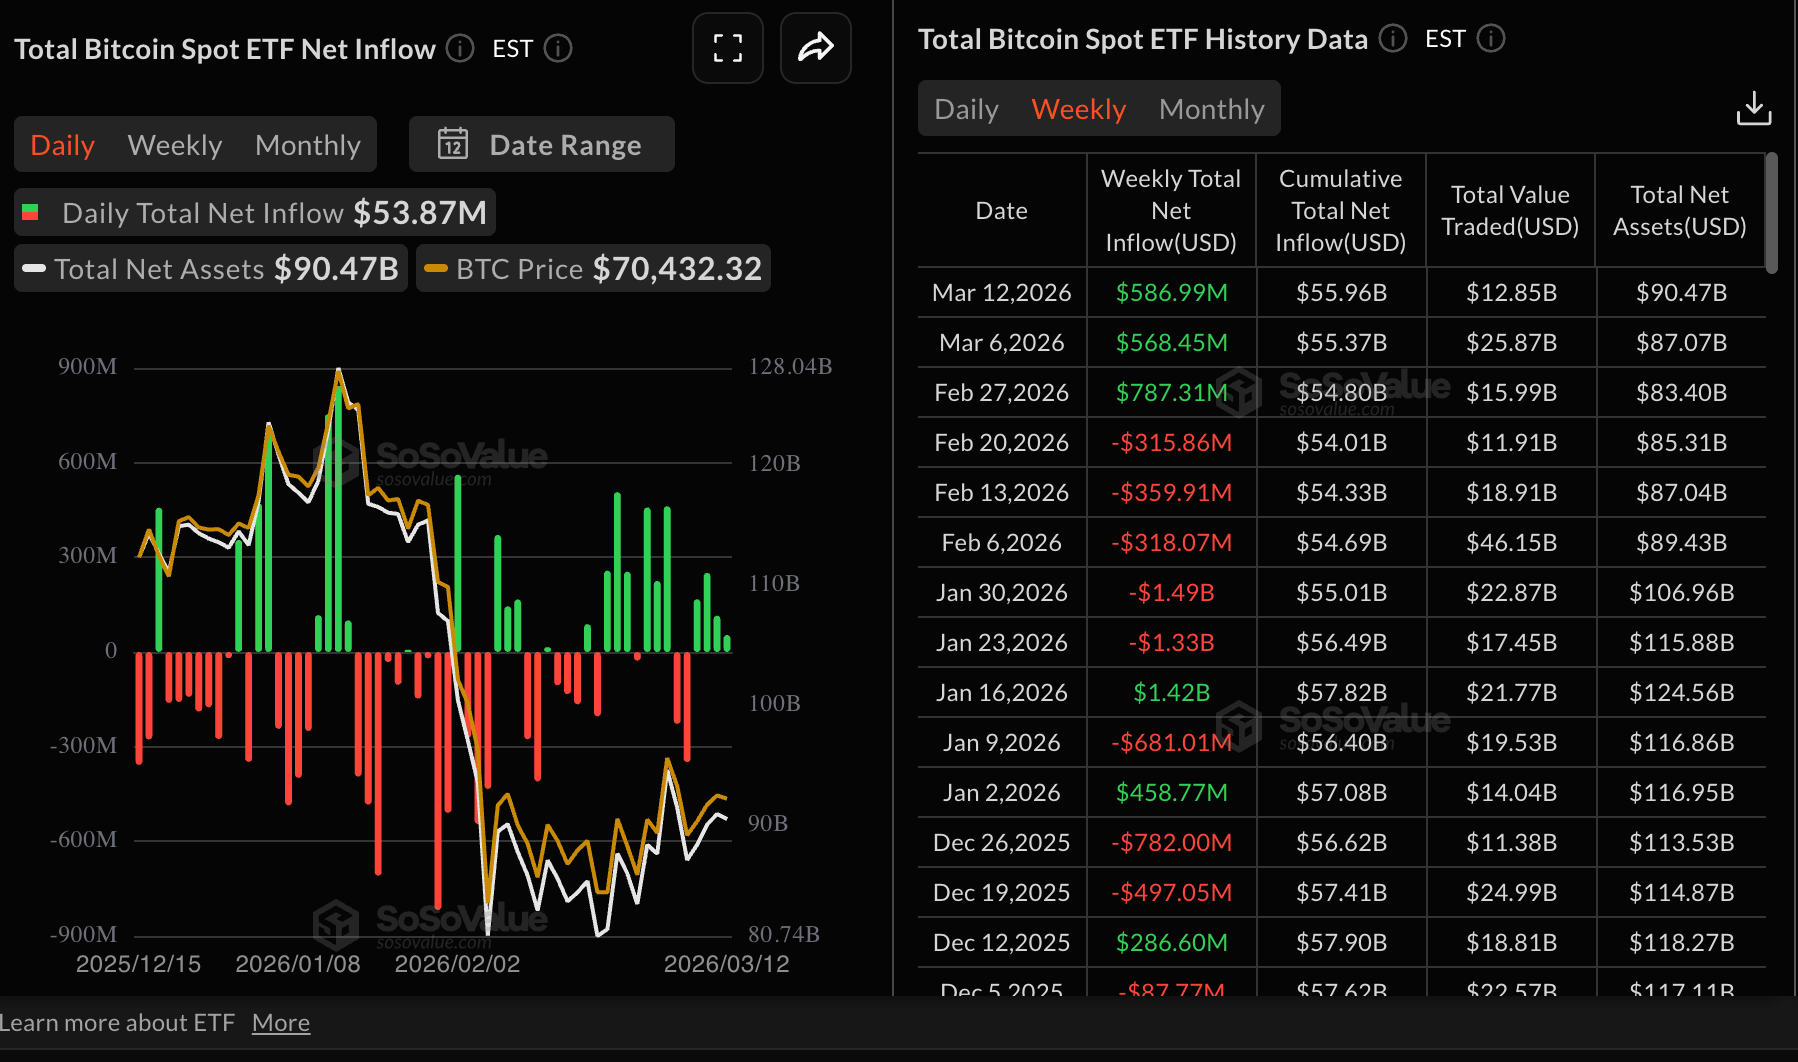
Bitcoin, on the other hand, is extending its recovery, trading above $71,000 on Friday from its weekly open of $65,971. Steady inflows into Spot Exchange-Traded Funds (ETFs) confirm the improving risk appetite despite the US-Iran war. SoSoValue data shows that BTC spot ETFs have recorded nearly $587 million in flows through Thursday this week, already indicating a slight increase from the previous week’s $568 million.
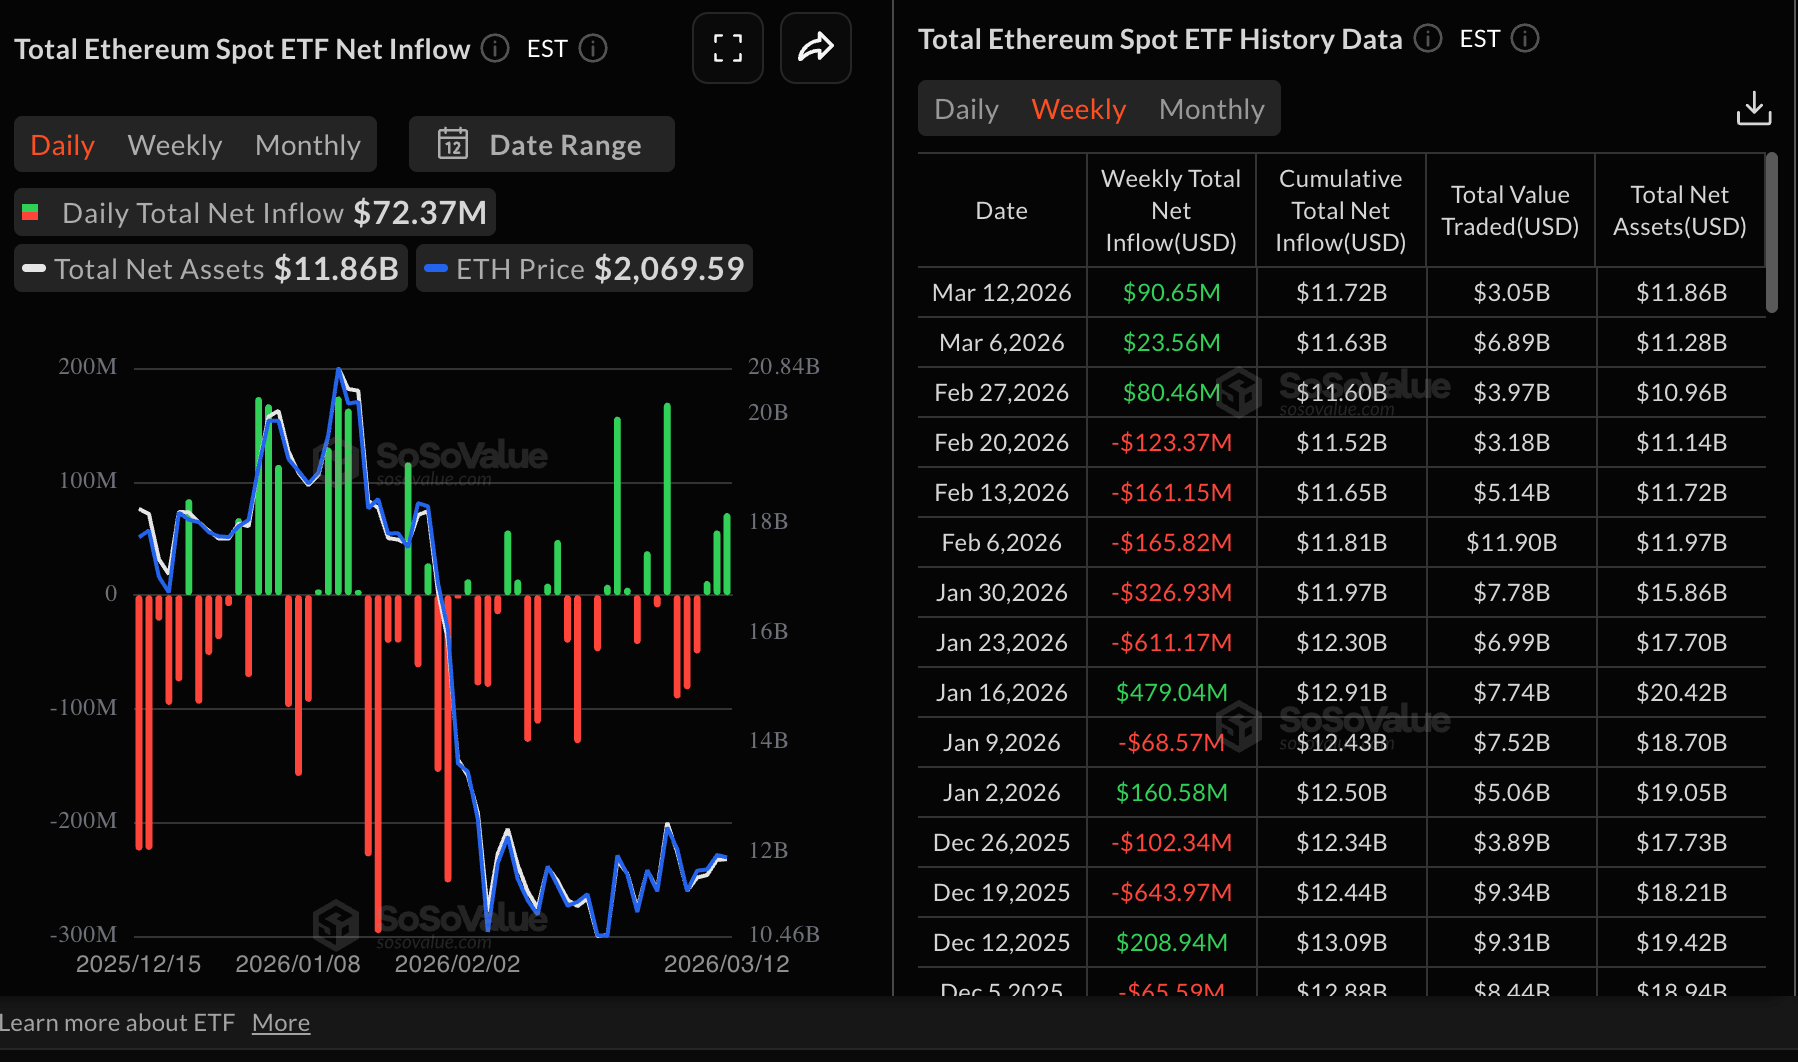
Ethereum spot ETFs are also set to extend inflows for three consecutive weeks, considering the nearly $91 million posted through Thursday. SoSoValue data shows that US-listed ETFs saw roughly $72 million in inflows on Thursday. Cumulative inflows stand at $11.72 billion with net assets at $11.86 billion.
Meanwhile, retail investors are increasing their exposure, piling into XRP long positions, as shown by CoinGlass’s Open Interest (OI)-Weighted Funding Rate, which stands at 0.0097% on Friday, up from 0.0015% the previous day. The metric had stayed in the negative region for three days since Tuesday, underscoring an improving risk appetite.
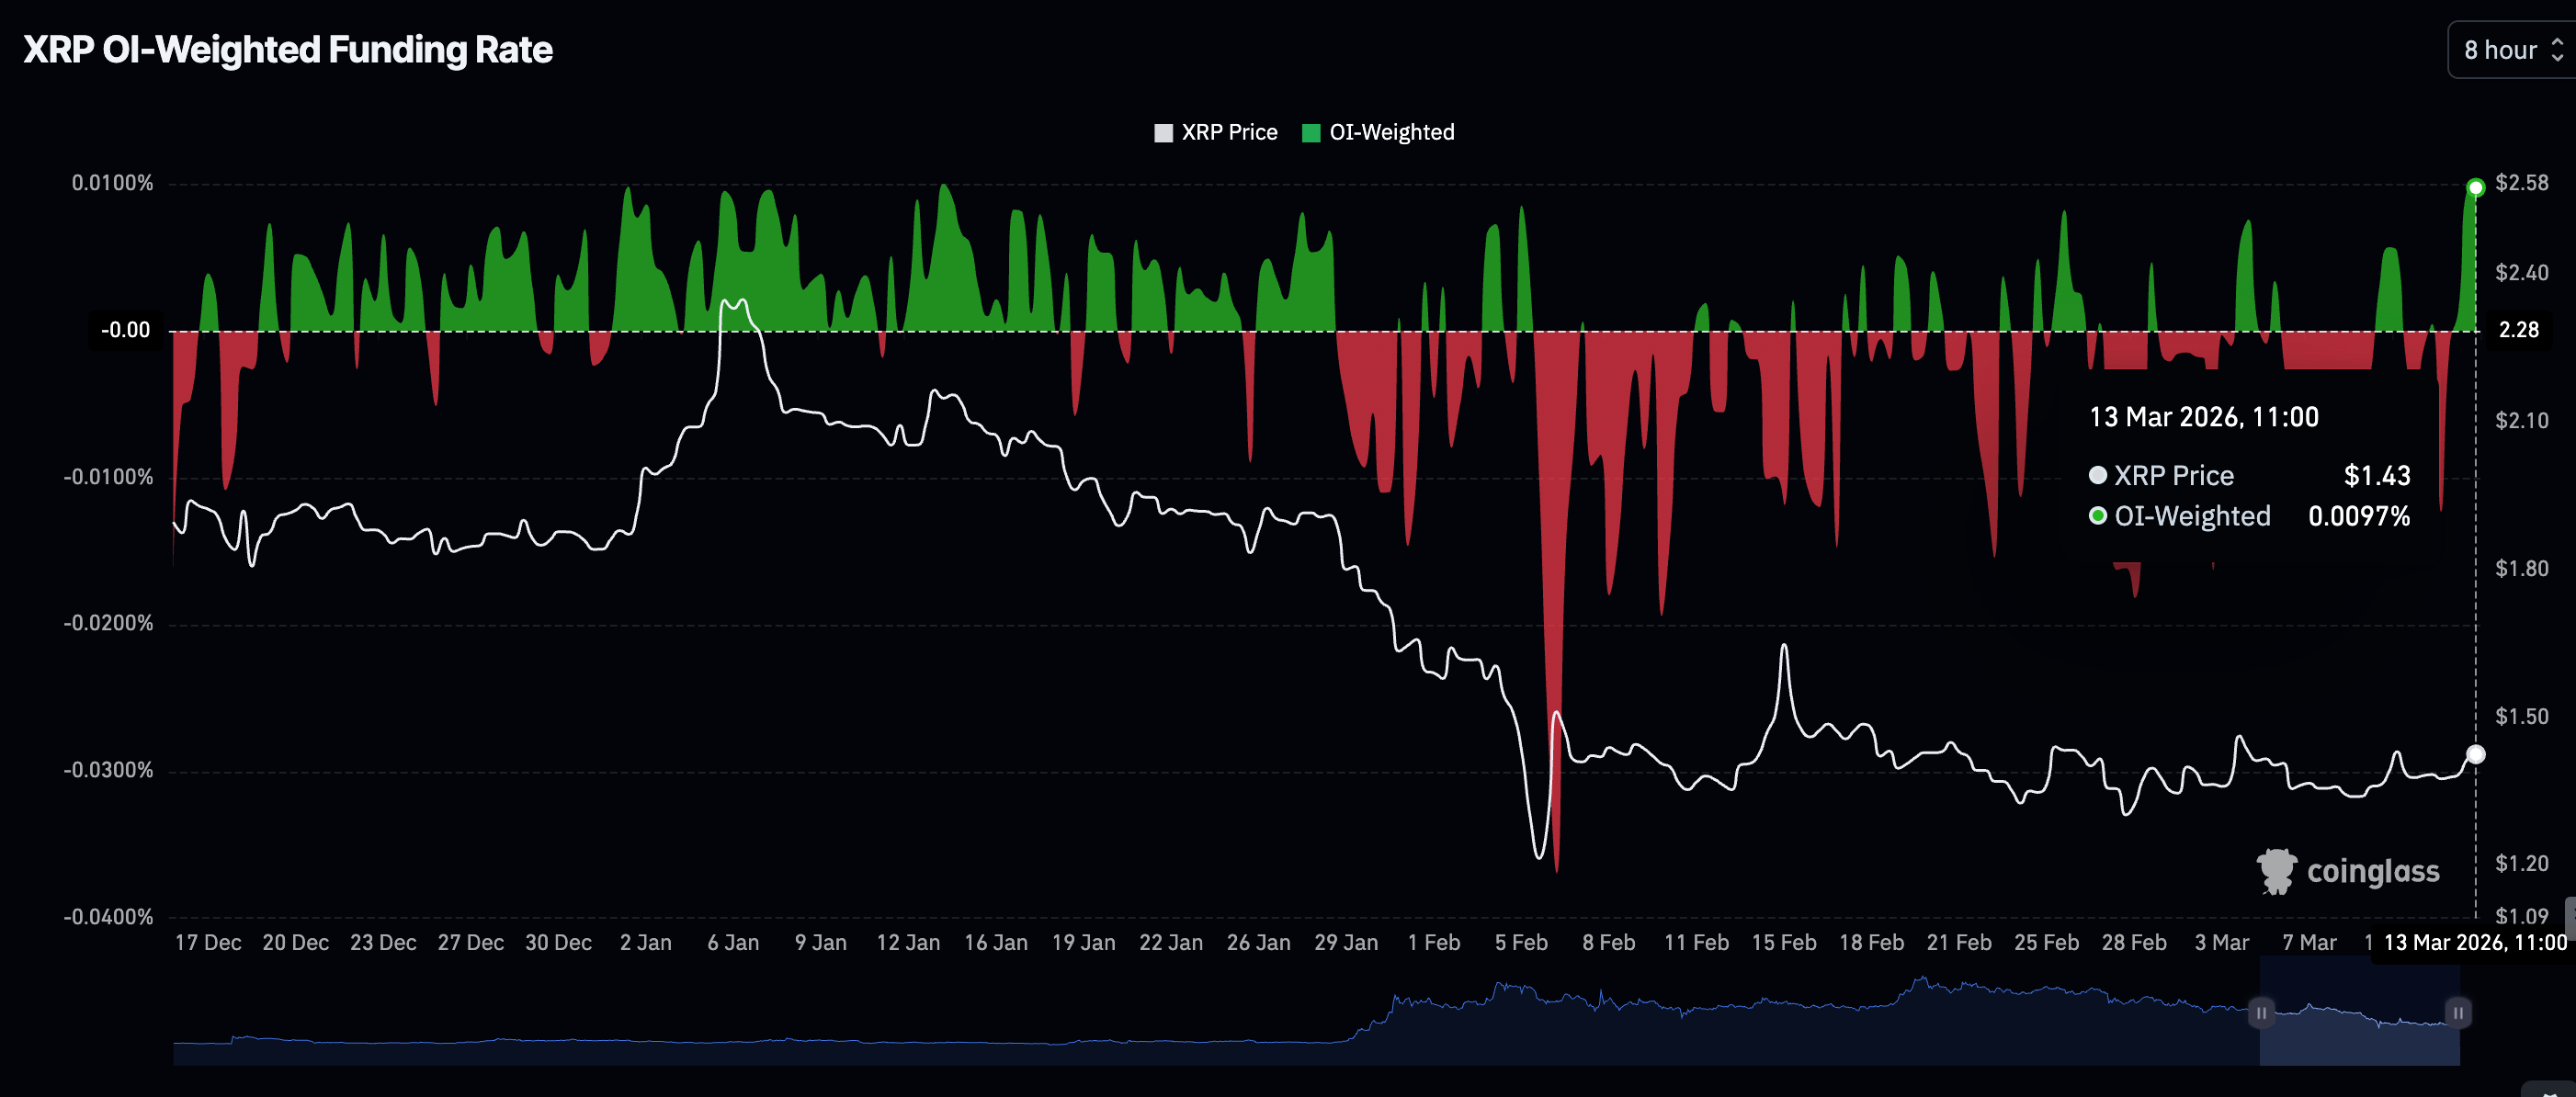
Chart of the day: Bitcoin poised to extend gains
Bitcoin is trading above $72,000 with the near-term bias cautiously bullish after the price pushed through the $70,000 handle. The Crypto King is closing in on the cluster of Exponential Moving Averages (EMAs) that continue to trend well above the current spot. The Moving Average Convergence Divergence (MACD) indicator is above its signal line on the daily chart, with widening green histogram bars, suggesting strengthening upside momentum after the recent consolidation.
The Relative Strength Index (RSI) has advanced through the midline on the same chart, indicating improving bullish pressure without reaching overbought conditions. However, as long as the long-standing descending resistance trend line remains unbroken, this will underscore the need for traders to remain cautiously bullish.
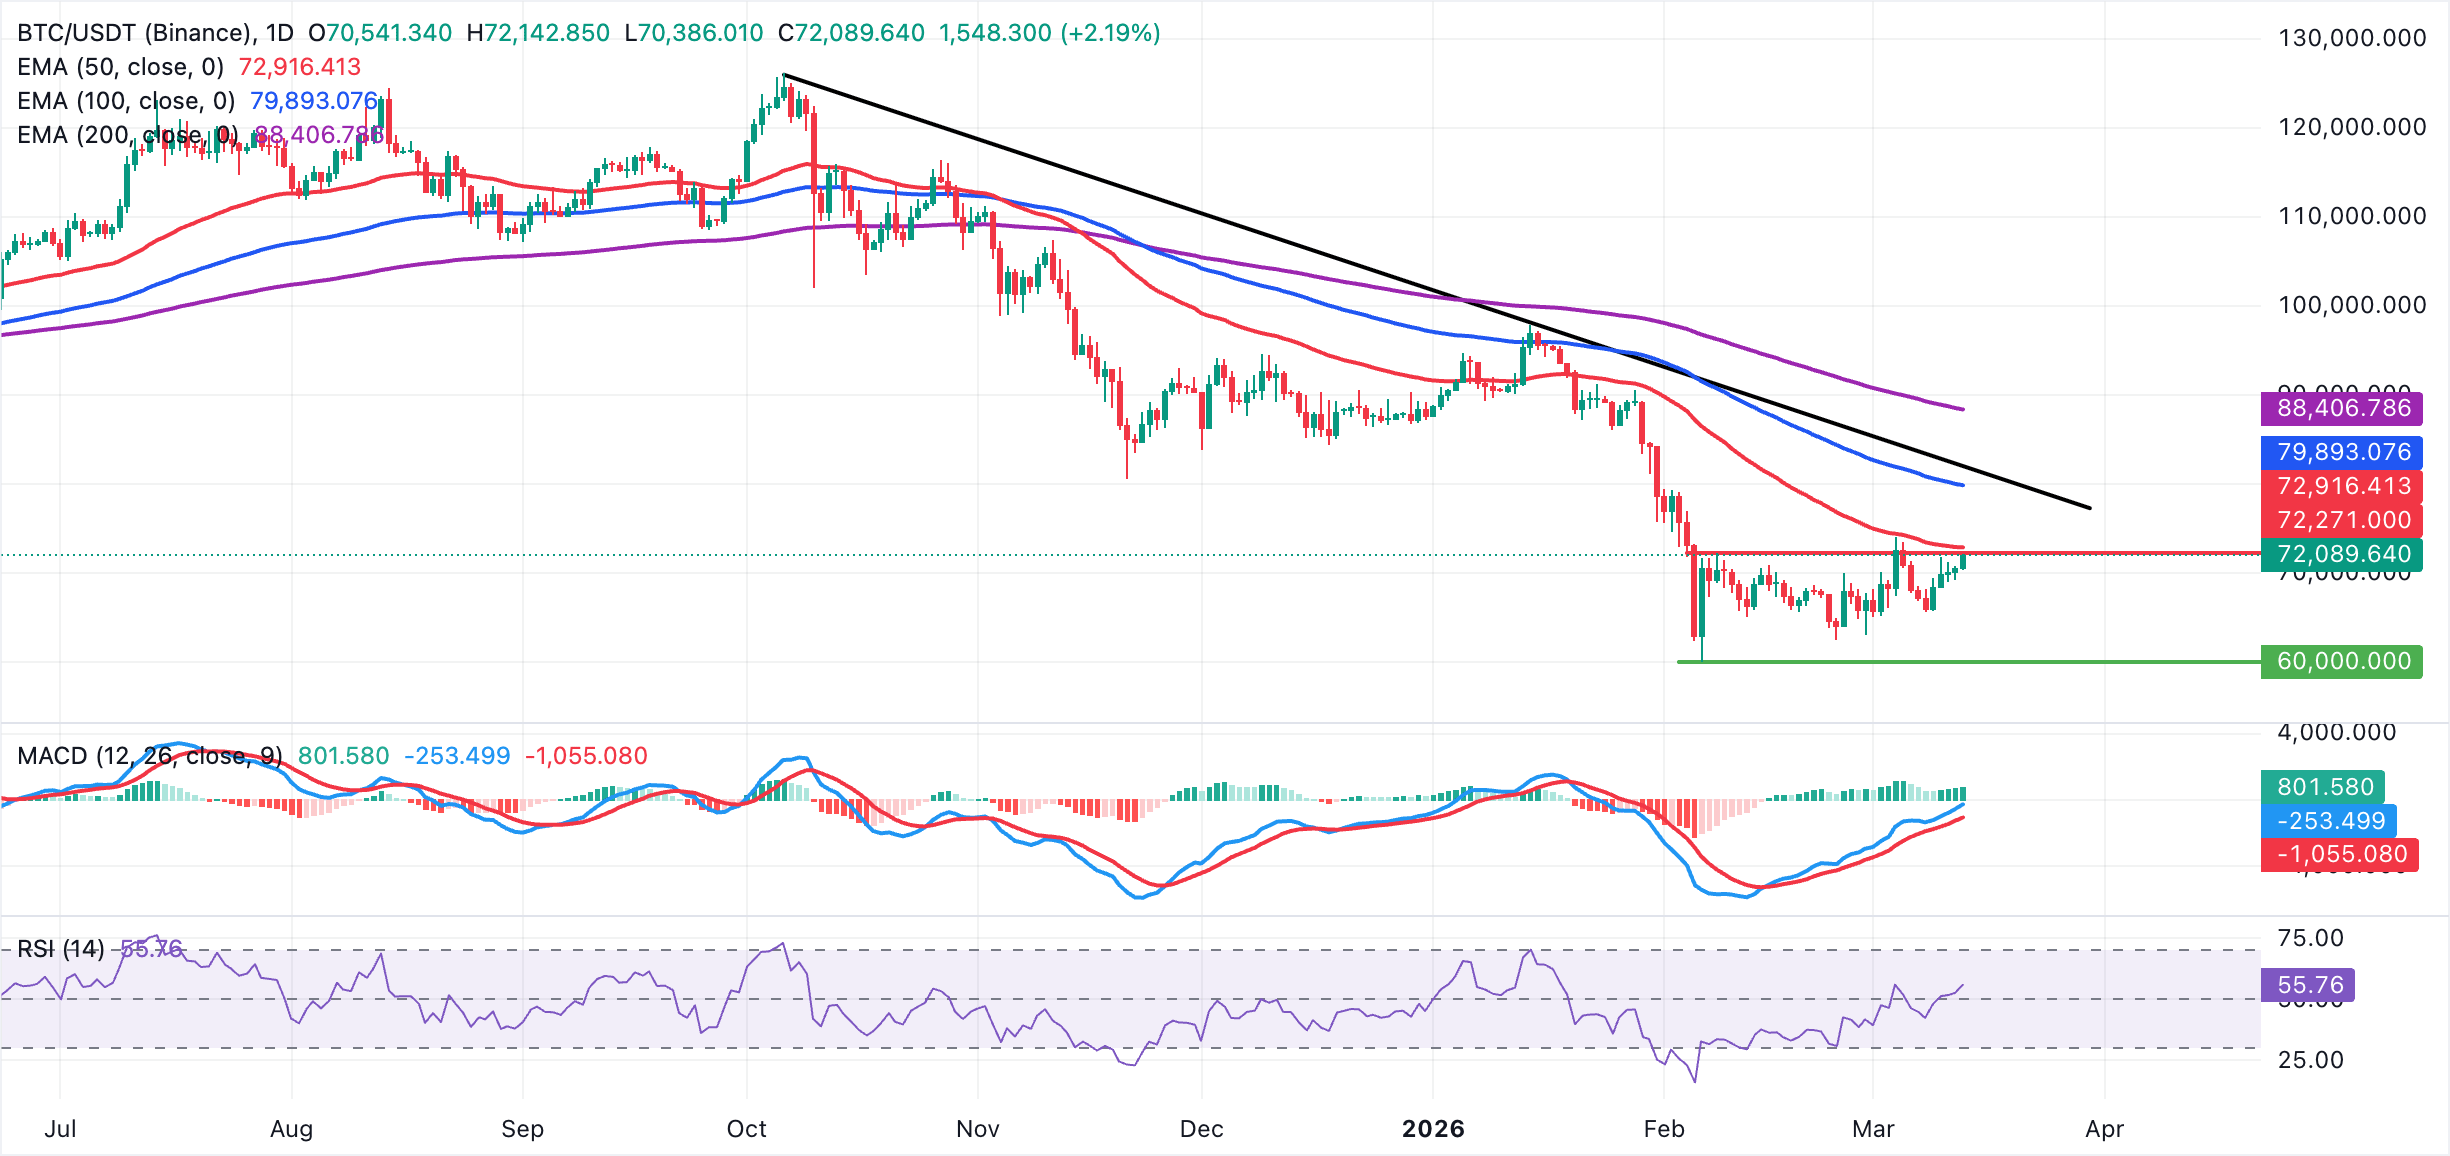
Initial support lies near $70,000, where recent breakout levels converge with short-term price congestion, followed by stronger support around $68,800, which guarded multiple pullbacks during the latest advance. A deeper setback would expose the $67,000 region as the next downside level, ahead of $65,900 as a more significant floor within the recent range.
On the topside, immediate resistance lies at the 50-day EMA, at $72,916, followed by $74,500 as the next upside objective if buyers maintain control. Beyond there, focus would shift to the broader resistance band near $80,000, as highlighted by the 100-day EMA.
Altcoins technical update: Ethereum, XRP edge higher
Ethereum hovers above $2,100, supported by a bullish wave across the crypto market. Its technical outlook appears notably bullish, with the RSI at 54 on the daily chart, reinforcing the bullish thesis but still far from overbought territory. Moreover, the MACD indicator is above its signal line on the same chart, with green histogram bars continuing to expand, prompting investors to increase their exposure.
A break above the range resistance around $2,200, which coincides with the 50-day EMA at $2,216, is required to extend gains, aiming for the 100-day EMA at $2,538 and then the 200-day EMA at $2,856.
Nonetheless, ETH trades below the clustered moving averages, so the move still unfolds within a broader corrective context defined by the long-standing descending resistance trend line from the record high of $4,956.
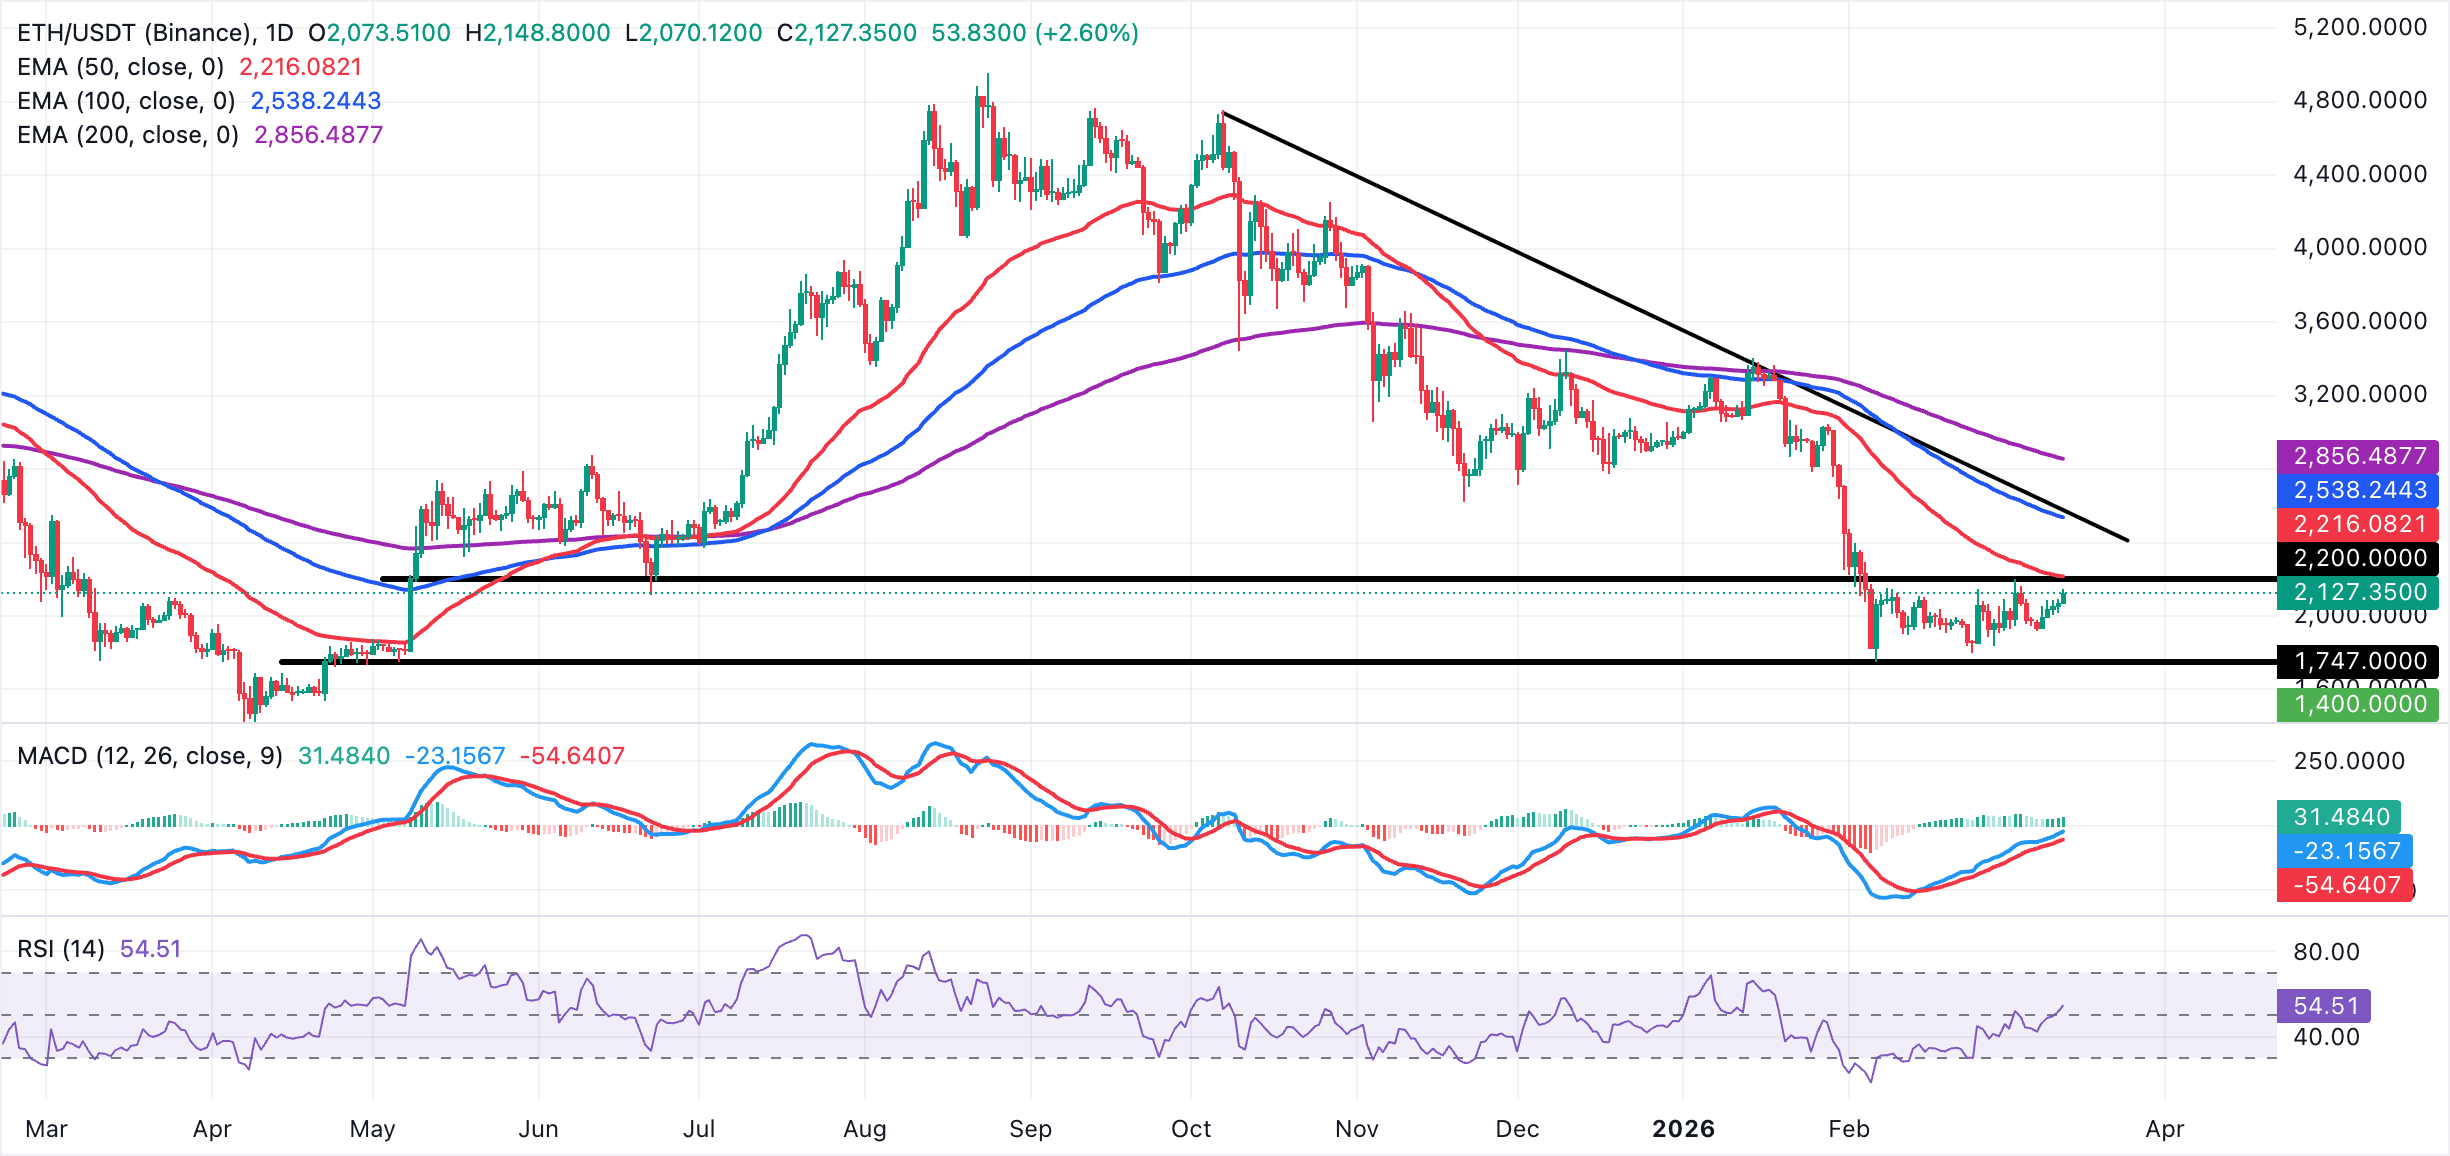
Initial support emerges at $2,050, where recent pullbacks stalled ahead of the $2,000 psychological handle. A break below this supply zone would expose the next downside level near $1,950, guarding more substantial support at $1,747, the February low.
XRP, on the other hand, is trading above $1.43 amid a cautious bullish shift, as the price stabilizes above the recent cluster of closes around $1.38–$1.40. The RSI at 51 on the daily chart shifts back above its midline, suggesting buyers are regaining initiative after a prolonged mid-range phase. At the same time, the MACD indicator remains above its signal line on the same chart, with green histograms steadily expanding, and confirming XRP's short-term bullish case.
Despite the daily increase from the opening of $1.38, XRP remains below the declining 50-day, 100-day and 200-day EMAs, which continue to frame a broader downtrend and cap upside expectations toward the descending trendline.
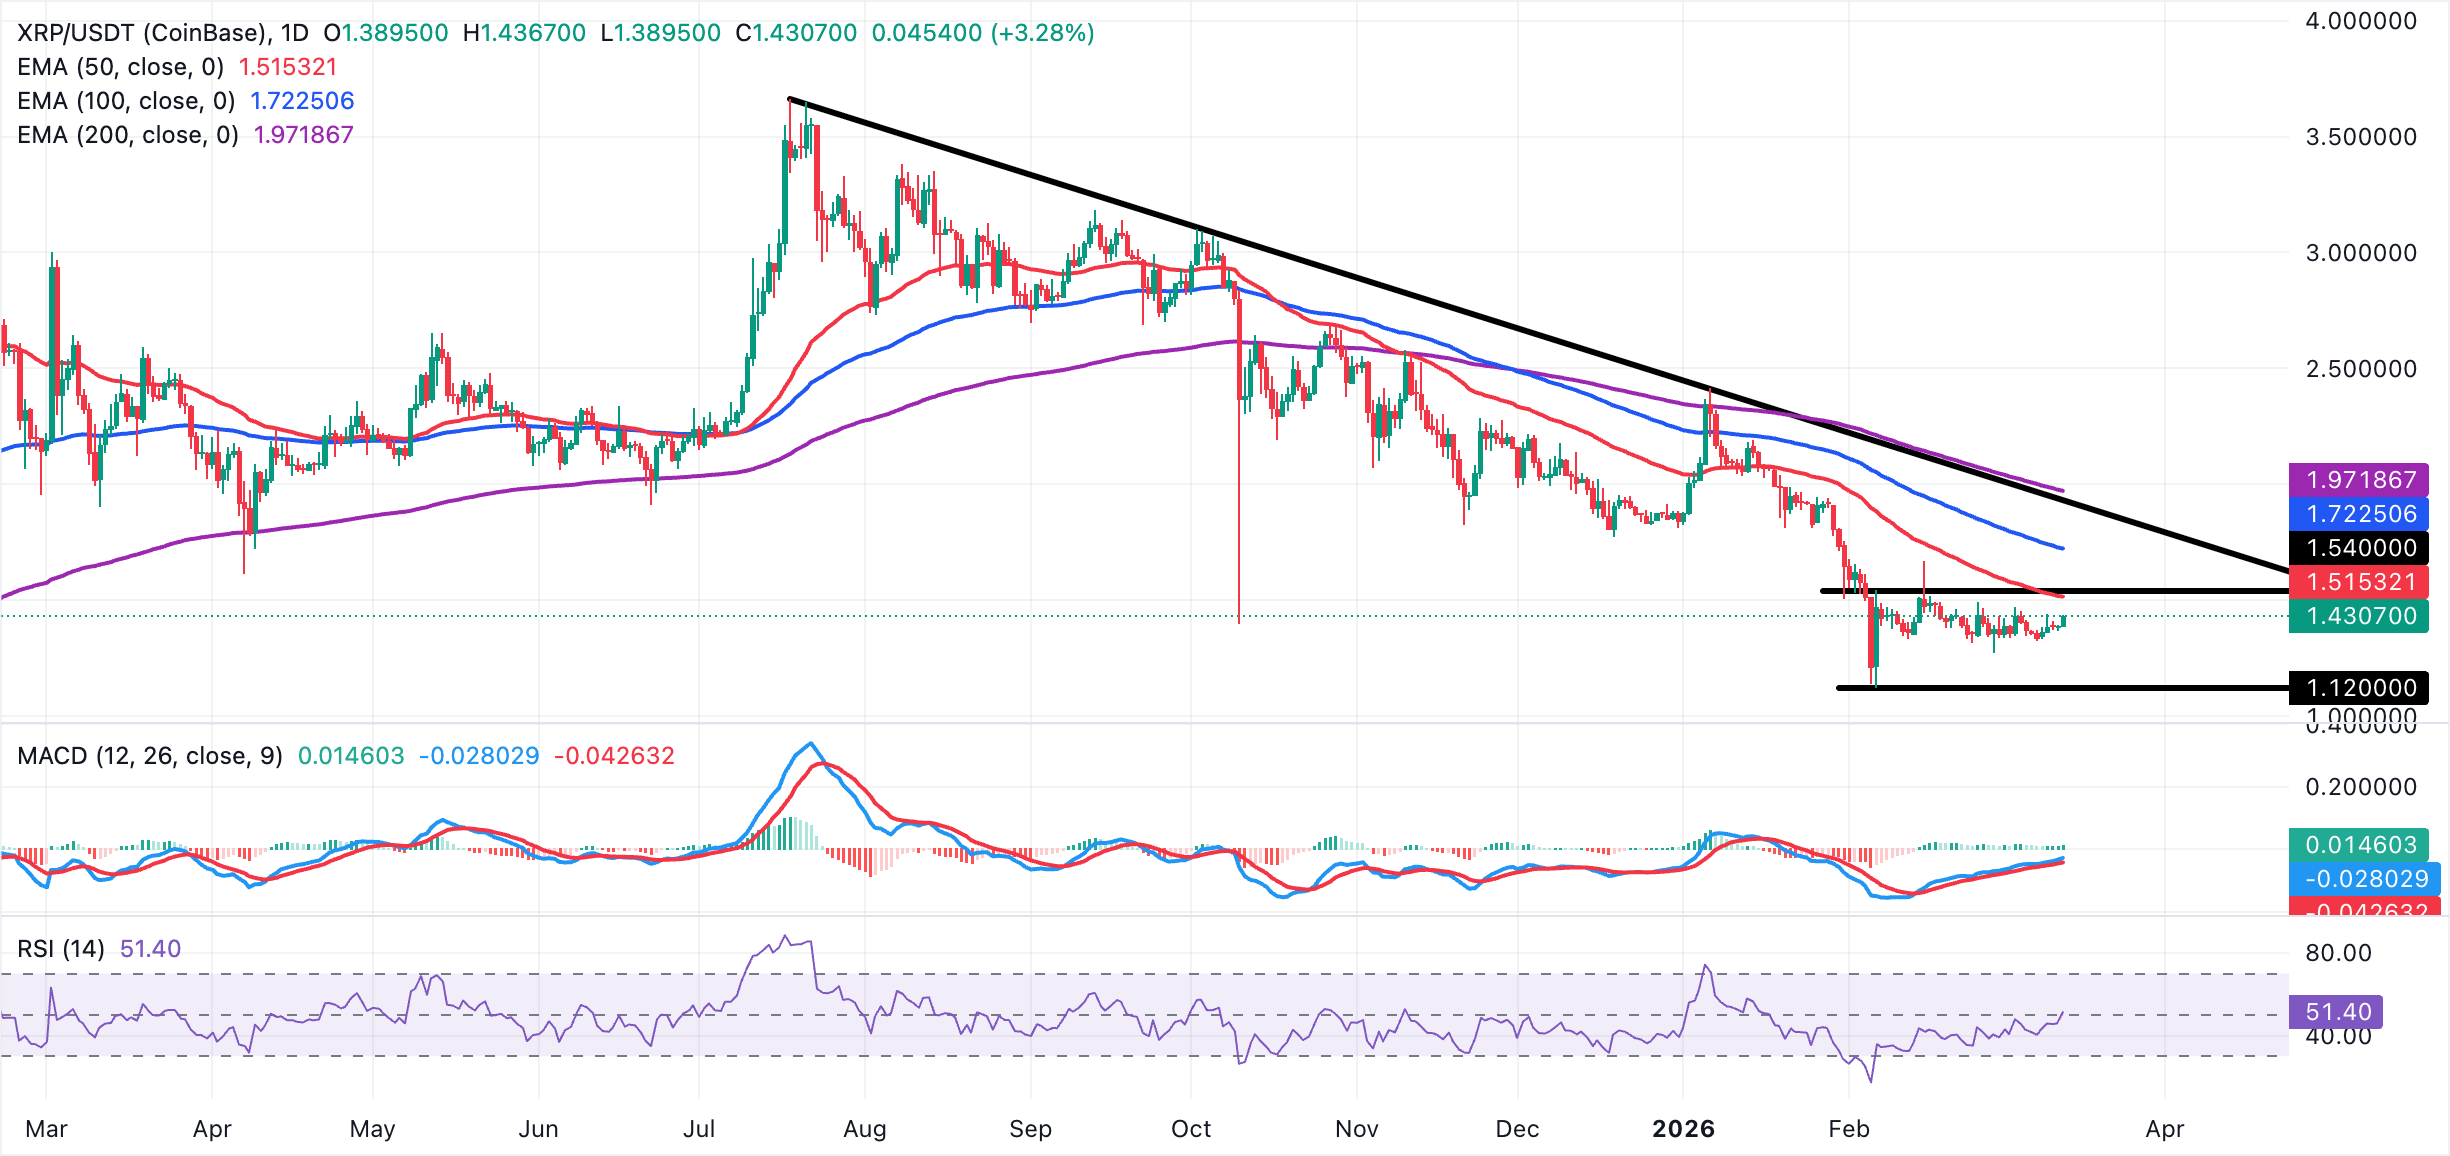
Initial support emerges at $1.40, defined by recent closing reactions, followed by $1.36 and $1.34, where previous lows cluster, and a break would weaken the nascent bullish tone. Below that, $1.30 becomes a pivotal downside level which, if lost, would expose the prior base of the range.


