Bitcoin (BTCUSD) just turned red on its Supertrend indicator on the 3W time-frame and that can actually be quite revealing for the remainder of the Bear Cycle.
First of all, with the exception of the 2018 Bear Cycle, there has historically been a very high symmetry between the Supertrend red and green switches. As you can see when the Supertrend turned green, long after the Bear Cycle bottom, it was almost around the same price level as when it turned red. It is a lagging indicator of course but says a lot about the cyclical structure of the market.
To, co jest jeszcze ważniejsze, to to, że historycznie (bez wyjątków), BTC zawsze osiągał 2.0 rozszerzenie Fibonacciego od szczytu świecy, która utworzyła czerwoną Supertrend, tworząc dno Cyklu marginalnie poniżej niego. W 2011 i 2018 roku nawet spadł poniżej odpowiednio 2.5 i 3.5 rozszerzeń Fib.
W obecnym Cyklu Niedźwiedzia, 50000$ spada marginalnie poniżej Fib 2.0, dlatego (jak już wcześniej wspomnieliśmy), to właściwy poziom, aby ponownie rozpocząć zakupy DCA na długi okres. Test 2.5 rozszerzenia Fib zbliżyłby nas nawet do 45000$, kolejnego kandydata na dno Cyklu według wielu modeli technicznych.
UDOSTĘPNIJ 🙌 jeśli podobał Ci się ten pomysł!
Artykuł
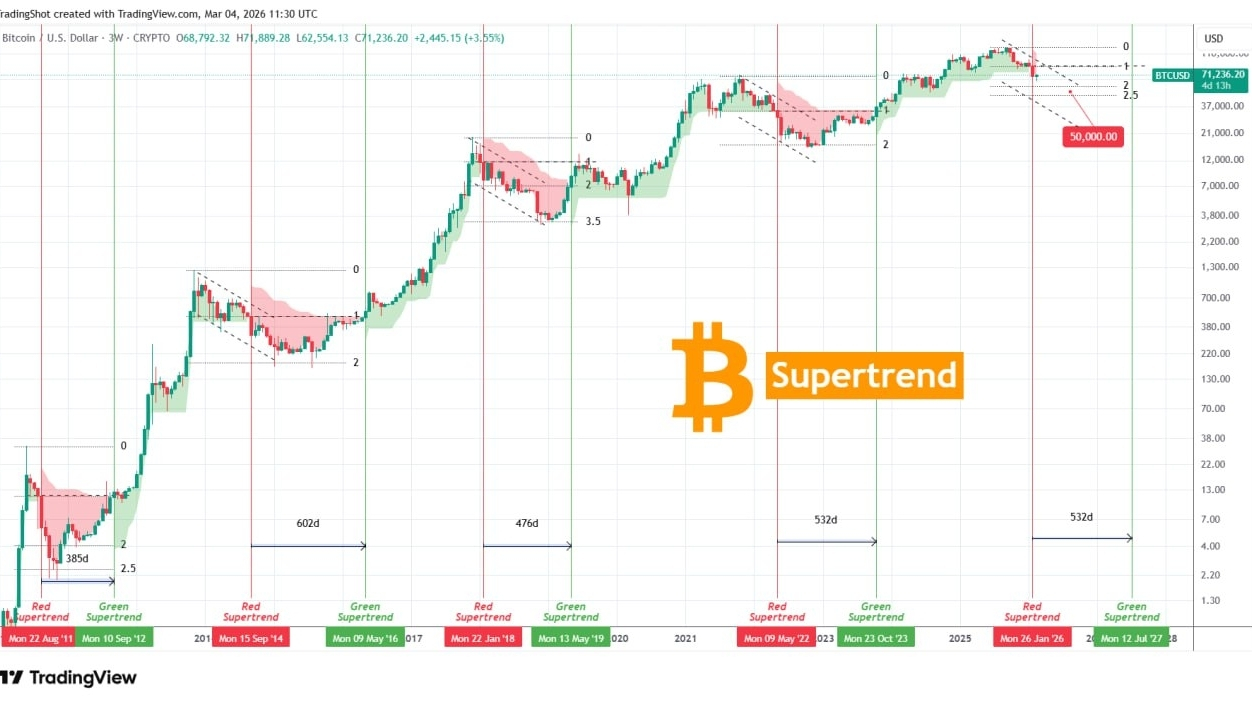
BITCOIN Supertrend📈 turned bearish giving hints on Cycle bottom.
--
Zastrzeżenie: zawiera opinie stron trzecich. To nie jest porada finansowa. Może zawierać treści sponsorowane. Zobacz Regulamin