of February 18, 2026, technical analysis for VANRY/USDT suggests several potential entry zones based on current support levels and trend patterns.
Technical Entry Points
Primary Support Zone ($0.0058 – $0.0061): This range is currently identified as a significant accumulation window. Historical data from earlier in February shows the price successfully testing and holding support in the $0.0058 area.
Aggressive Entry ($0.0063): For traders looking for immediate momentum, the current trading range around $0.0063 is considered an early recovery stage as the token attempts to reclaim its short-term moving averages.
Deep Support/Wait-and-See ($0.0045 – $0.0051): If the broader market experiences a correction, a secondary entry point exists near the yearly low of $0.0045. Some models also suggest $0.0051 as a potential "neutral" bottom for 2026. 
Key Resistance Levels (Exit/Take-Profit)
If you enter at current levels, monitor these resistance zones for potential pullbacks:
$0.0067: Immediate overhead resistance; flipping this level on the 4-hour chart would confirm a relief rally.
$0.0082: A key liquidity level and previous breakdown zone for late February.
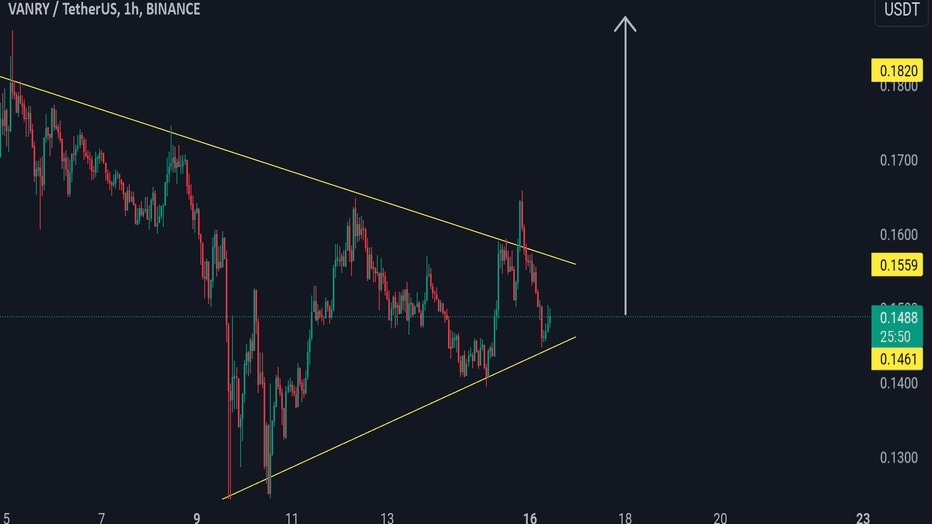
$0.0115: A long-term macro target if VANRY breaks out of its current "Falling Wedge" pattern.
Current Market Sentiment
Signal: Mixed. Daily indicators show a "Strong Sell" on some platforms due to falling moving averages, while 4-hour charts show the 50-day moving average beginning to slope upward, indicating short-term bullish potential.
Risk Warning: If the price falls and stays below $0.0058, analysts warn of increased selling pressure that could lead back toward the yearly lows.
Disclaimer: This information is based on current market data and technical indicators. Cryptocurrency investments carry high risk; always conduct your own research before trade