
Whether you're trading Bitcoin $BTC or altcoins, technical indicators can help you understand market trends, momentum, and potential entry points. While no indicator guarantees profits, using the right combination can improve your decision-making.
Here are 3 powerful indicators many traders rely on:
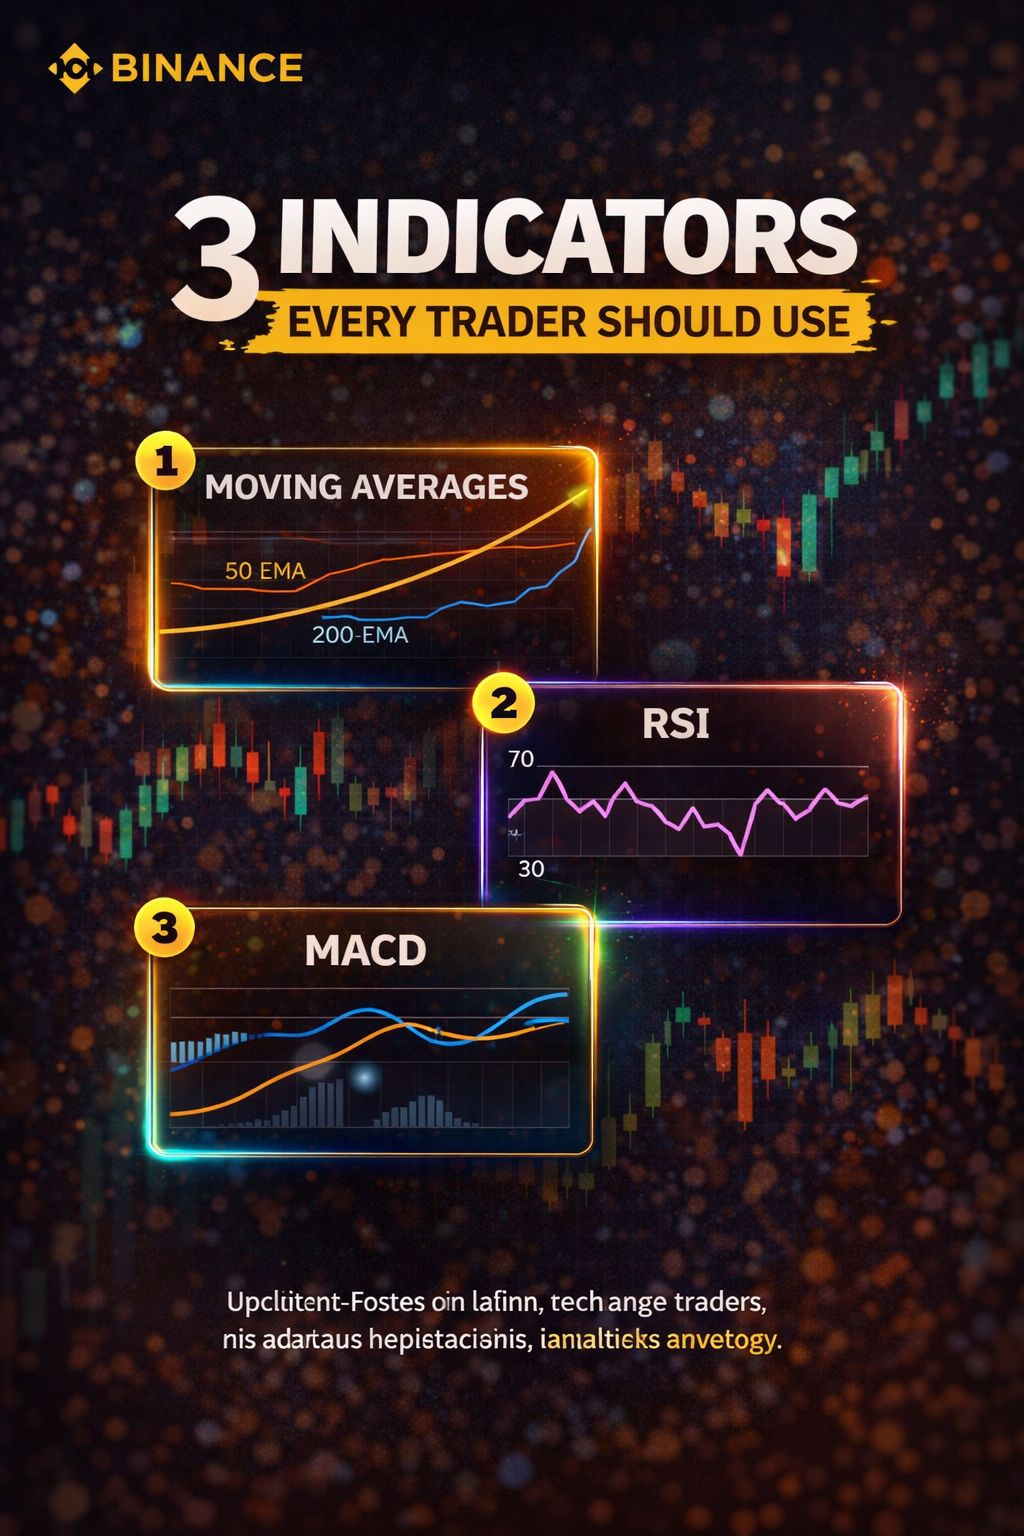
📈 1️⃣ Moving Averages (MA)
Moving averages help identify the overall trend direction by smoothing out price fluctuations.
Commonly used averages: • 50 MA – short to mid-term trend
• 200 MA – long-term trend
🔹 When price is above the moving average, the market is usually bullish.
🔹 When price is below the moving average, the trend may be bearish.
Many traders watch golden cross and death cross signals for trend shifts.
⚡ 2️⃣ RSI (Relative Strength Index)
RSI measures market momentum and helps identify overbought or oversold conditions.
RSI levels: • Above 70 → Overbought (possible pullback)
• Below 30 → Oversold (possible bounce)
RSI is especially useful during sideways markets when assets like Ethereum are consolidating.
📊 3️⃣ MACD (Moving Average Convergence Divergence)
MACD helps traders understand trend momentum and potential reversals.
Key signals: • MACD line crossing above signal line → bullish momentum
• MACD line crossing below signal line → bearish momentum
MACD is widely used for confirming breakouts in many altcoins such as Solana.
💡 Pro Tip
Don’t rely on a single indicator.
Most experienced traders combine trend indicators + momentum indicators + support/resistance analysis.
Remember: indicators help guide decisions, but risk management is always the most important strategy.
💬 Which indicator do you use the most — MA, RSI, or MACD?
#cryptotrading #tradingtips #bitcoin #BinanceSquare #CryptoAnalysis"