Market Structure:#BTC 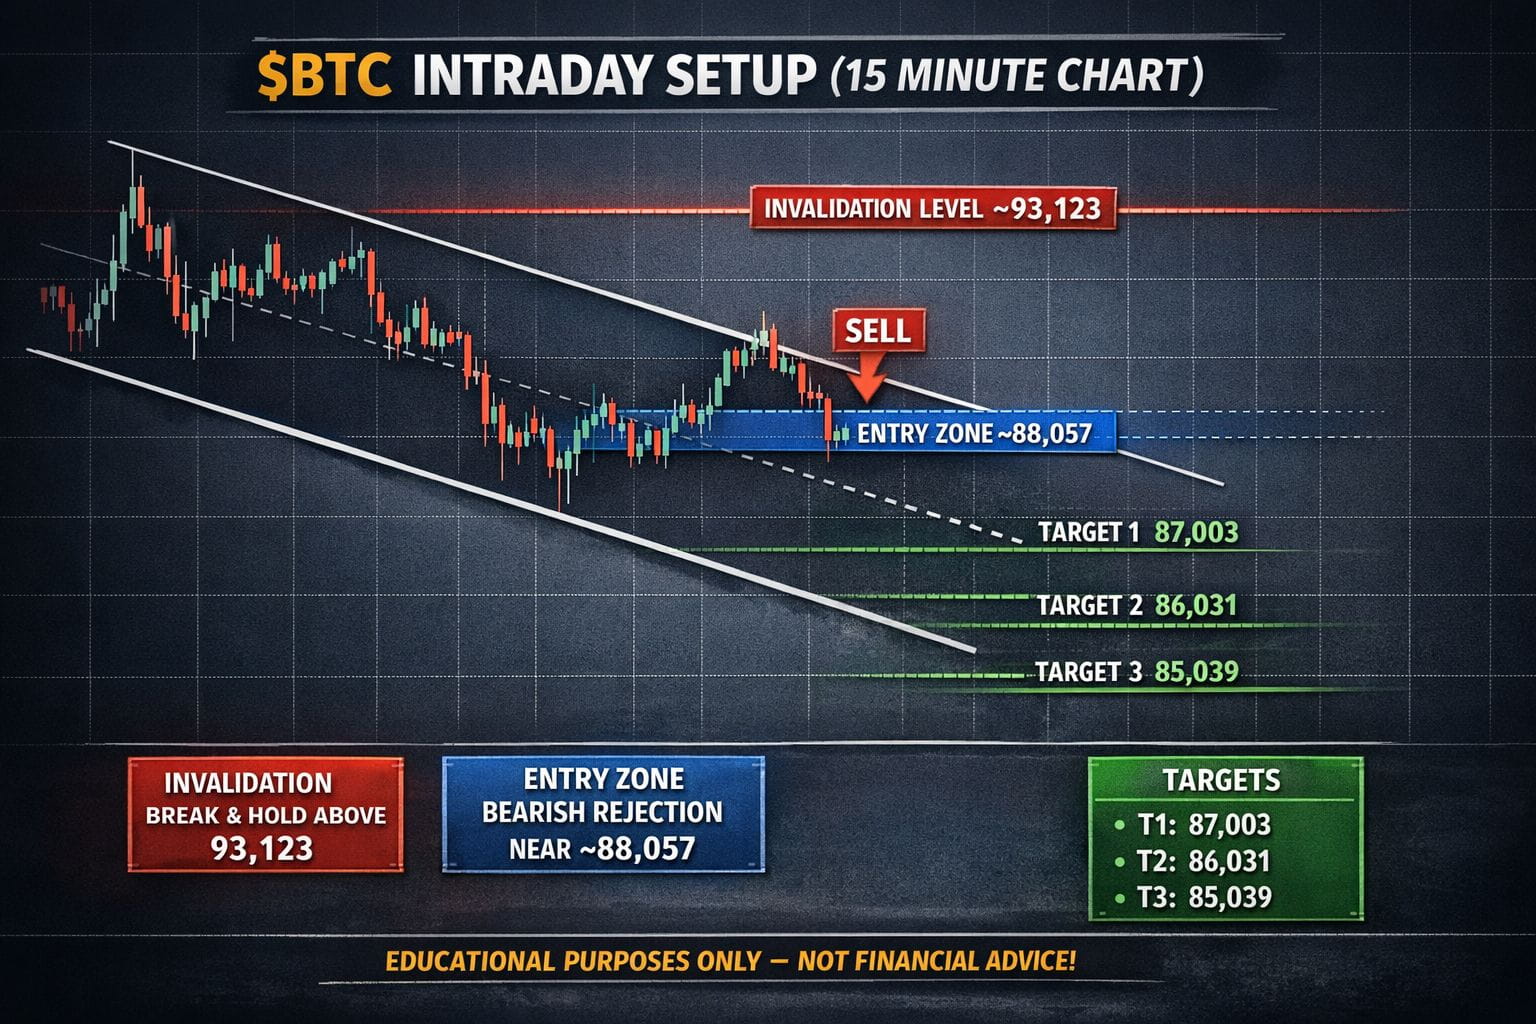
Bitcoin price is currently trading within a well-defined descending channel on the 15-minute timeframe. After a short-lived push above the channel’s midline, price has rotated back and is now retesting the upper half of the channel, keeping the broader intraday structure bearish.
Trade Idea (As Marked on Chart):
I’m stalking a short setup on a lower-timeframe bearish rejection near the channel’s upper boundary.
Entry Zone: ~88,057 (blue level)
This aligns with the prevailing intraday downtrend and offers a favorable risk-to-reward if rejection confirms.
Confirmation Approach:
No anticipation. I’ll wait for clear bearish price action at the retest — such as:
Upper-wick rejection
Bearish engulfing candle
Failed breakout / deviation above resistance
Invalidation:
A clean break and sustained hold above ~93,123 (red line) invalidates this short thesis.
If that happens, I’ll step aside and reassess the market structure.
Downside Targets (Stepped TP Levels):
These targets align with prior reaction zones and the lower boundary of the channel:
T1: ~87,003
T2: ~86,031
T3: ~85,039
Risk Management:
Position size kept small and controlled
Move stop to break-even after T1
If price accepts above invalidation → trade closed, bias neutral
Bias & Context:
Trend remains bearish as long as price trades below the channel’s upper boundary and the invalidation zone. Bulls need acceptance above resistance to flip momentum; until then, rallies are viewed as sell-side opportunities.
Notes:
This is educational content only — not financial advice.
Levels are approximate, and I’ll adapt based on real-time price action.
No solicitation. Purely technical analysis.
DISCLAIMER:
THIS IS FOR EDUCATIONAL PURPOSES ONLY — NOT FINANCIAL ADVICE.
