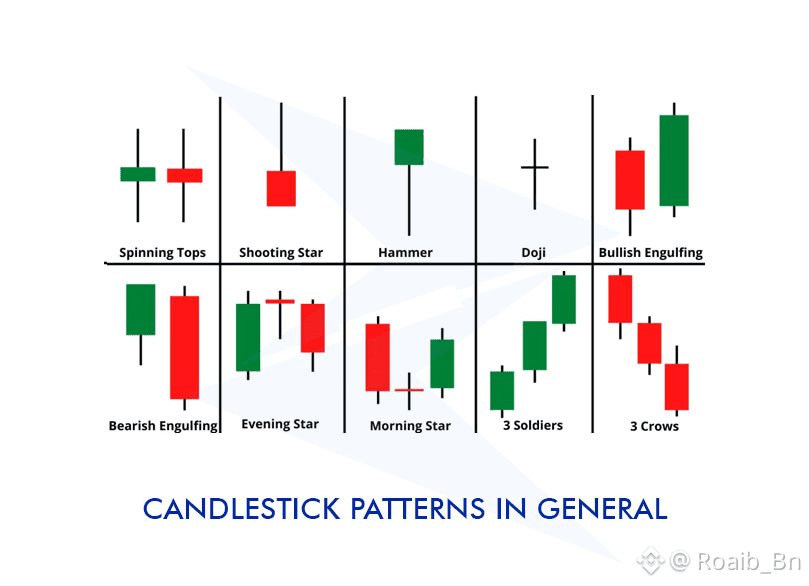
Spinning Tops👇
This candle shows balance between buyers and sellers
Price moved both ways but closed near the open
It signals uncertainty and a possible pause in trend
Shooting Star👇
Buyers pushed price higher but sellers took control
The long upper wick shows strong rejection
Often appears near tops and warns of a reversal
Hammer👇
Sellers pushed price down but buyers recovered strongly
The long lower wick shows rejection of lower prices
It often signals a possible bullish reversal after a drop
Doji👇
Buyers and sellers were equally strong
Price opened and closed at almost the same level
It shows indecision and the need for confirmation
Bullish Engulfing👇
Buyers completely overpower sellers
The green candle covers the previous red candle
It often signals a strong bullish reversal
Bearish Engulfing👇
Sellers fully take control from buyers
The red candle covers the previous green candle
It often signals a bearish reversal
Evening Star👇
Buyers lose momentum after an uptrend
Indecision appears before sellers step in
It is a warning sign of trend reversal downward
Morning Star👇
Selling pressure starts to weaken
Buyers slowly regain control
It often marks the start of a bullish reversal
Three Soldiers👇
Strong buyers enter the market continuously
Each candle closes higher than the previous
It shows strong bullish momentum
Three Crows👇
Strong sellers dominate for several periods
Each candle closes lower than the previous
It shows strong bearish momentum
Candlesticks are not magic
They are a reflection of market psychology
Understanding them helps you trade with clarity not emotion
Here is the candlestick patterns image 👇
If you found this helpful then please follow like and comment on it thanks
#MarketRebound #BTC100kNext? #StrategyBTCPurchase #CPIWatch #USJobsData
