
Bitcoin has entered a high-volatility phase after breaking below key support zones and accelerating toward the $60,000 area. The latest market structure shows strong bearish momentum, but several indicators suggest that BTC is approaching a region where short-term relief rallies often begin.
Market Overview
The crypto market cap has declined from approximately $2.50T to $2.08T, while sentiment remains extremely fearful. The Crypto Fear & Greed Index is at 12, indicating panic conditions across the market. Historically, such extreme fear often appears near local bottoms rather than major tops.
At the same time:
BTC Spot ETF inflows remain positive.
RSI on the daily timeframe is deeply oversold.
Funding rates are negative.
Open Interest is decreasing, signaling leverage is being flushed out.
These conditions typically occur during late-stage corrections.
Technical Analysis
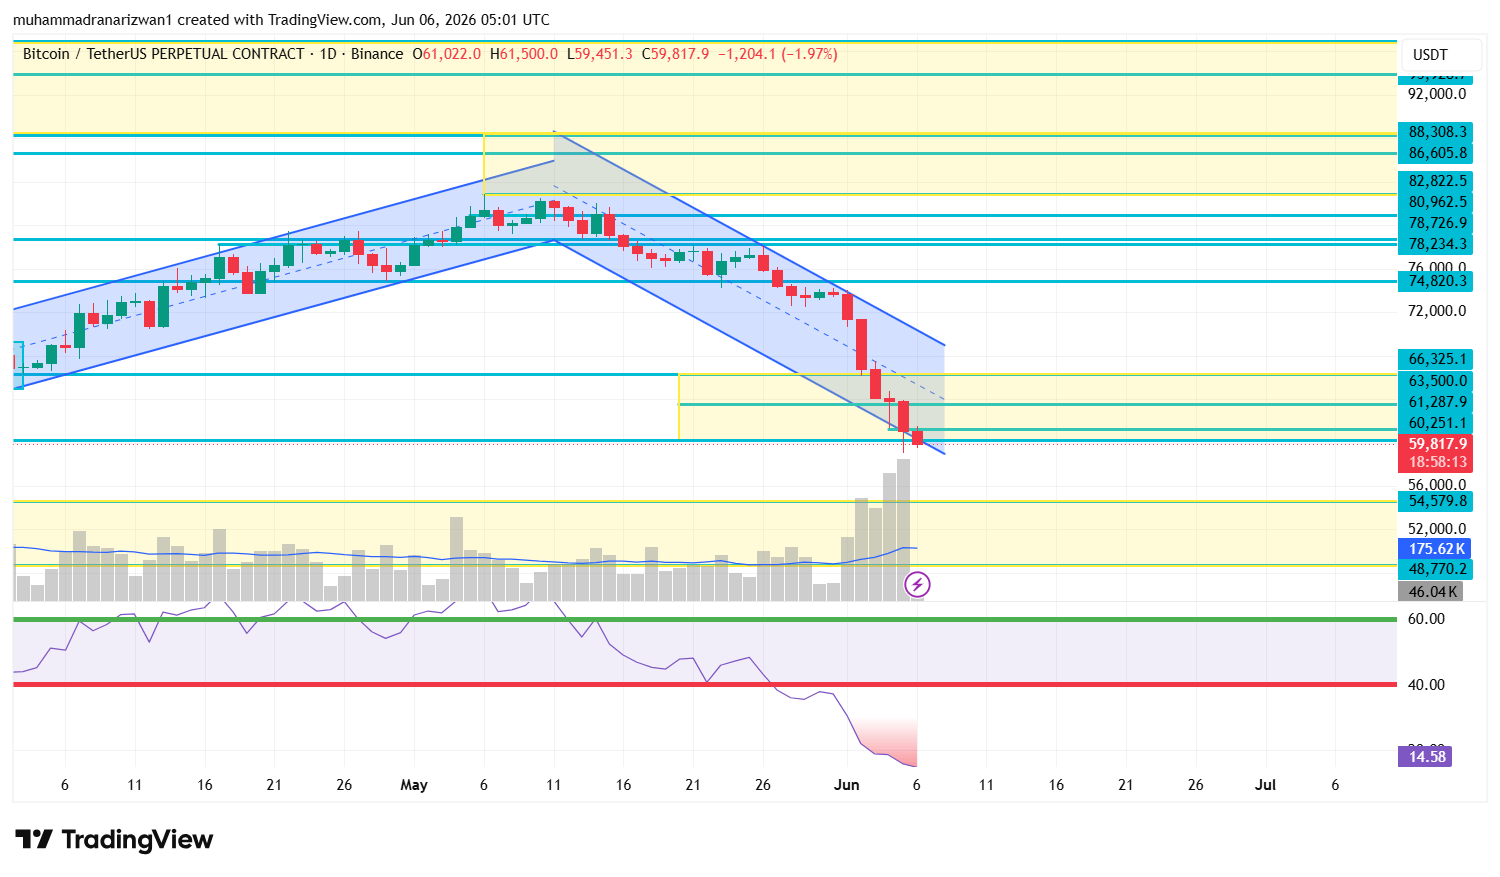
Bitcoin is currently trading around $59,800-$60,000, sitting directly on a major support zone.
Key Support Levels
$59,800 (Immediate Support)
$57,000
$54,600 (Major Demand Zone)
$48,700 (Worst-case support)
Key Resistance Levels
$61,300
$63,500
$66,300
$74,800 (Major Resistance)
The daily chart remains inside a strong bearish structure after breaking below the descending channel. However, the RSI near 15 indicates extremely oversold conditions, increasing the probability of a short-term bounce.
Liquidity & Sentiment Signals
CoinGlass liquidation data shows:
Large short liquidity near $62,100
Significant long liquidations already triggered below $59,000
Negative funding rate suggests traders are heavily positioned on the short side
When funding becomes excessively negative and fear reaches extreme levels, markets often squeeze shorts before deciding the next major trend.
Trading Signal
Bullish Scenario 📈
Entry: $59,500 – $60,200
Targets:
TP1: $61,300
TP2: $63,500
TP3: $66,300
Stop Loss:
Below $57,000
Bearish Scenario 📉
If BTC closes a daily candle below $57,000:
Targets:
$54,600
$52,000
$48,700
Final Verdict
Bitcoin remains bearish on the higher timeframe, but the market is now entering an oversold region where sharp relief rallies become increasingly likely. As long as BTC holds above the $59,000-$57,000 support zone, traders should watch for a potential recovery toward $61K-$66K.
A breakdown below $57K would invalidate the bullish bounce setup and open the door for a deeper correction toward the mid-$50K region.
Current Bias: Short-Term Bullish Bounce ⚡ | Long-Term Trend Still Bearish 📉
Will Bitcoin defend the $60K support and trigger a relief rally toward $63K–$66K, or will bears push the price below $57K for another leg down?
💬 Share your target and trading plan in the comments.
👍 Like & Follow for daily Bitcoin market insights, trading setups, and real-time crypto analysis.
⚠️ Always use proper risk management and never risk more than you can afford to lose.
Are you Bullish 🐂 or Bearish 🐻 on BTC today? 👇🔥