
 📊 The structure, areas, and potential playbook
Below is a clean, organized, and professional analysis of the chart you provided, using emojis for clarity while keeping the analysis at a high level and relevant for traders.
🔍 📌 Market structure analysis
🟡 General context
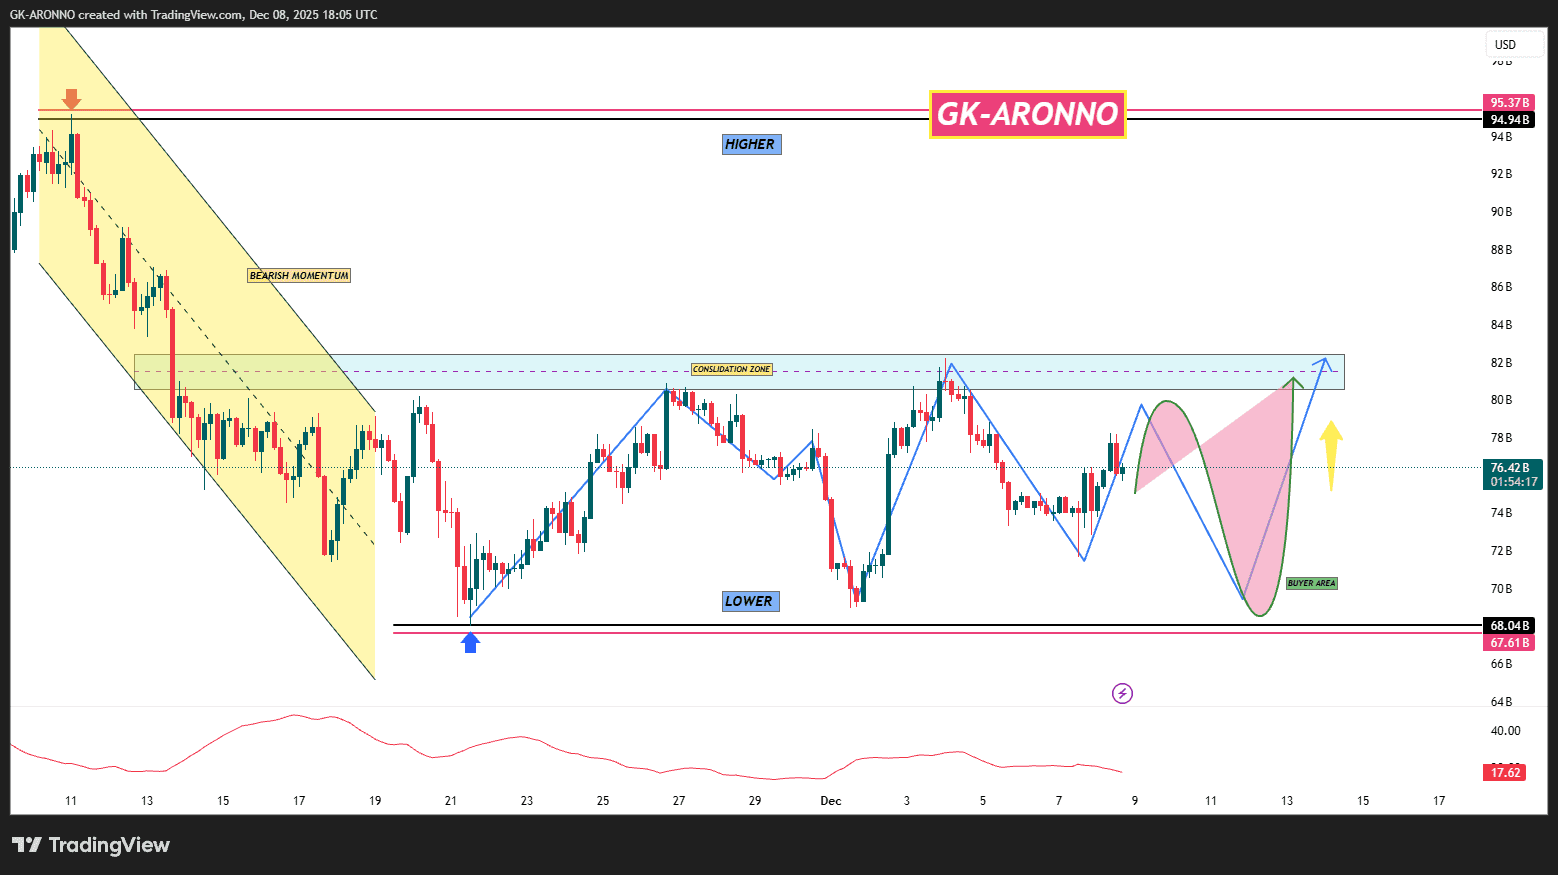
The price shifted from a strong downward momentum 📉 (downward channel on the left side)
To a range/consolidation phase 📦.
The market is currently trying to shift from bearish sentiment → neutral → potentially bullish.
🔵 1. Bearish Momentum → Structure Break
The yellow descending channel shows clear bearish pressure.
A breakout from that channel indicates the first sign of momentum weakness.
The price found a strong demand area (buyer) around 67–68 💎, forming a base (blue arrow).
🟢 2. Range/Consolidation Area (Main Area 78–84)
The market is consolidating within a horizontal supply/resistance area between 78–84.
This is the decision area where price gathers liquidity before the next major move.
Several liquidity pulls (equal highs and lows) within this area confirm accumulation/distribution behavior.
🔵 3. Structural Shifts: Low → High
The chart shows a strong higher low (HL) and break above the secondary structure.
This indicates a bullish structural shift but won't confirm until the price closes above 83.50–84.
🟢 4. Buyers' Area and Retracement Expectations
I have identified the "Buyers' Area" around 72–73, which corresponds with:
FVG (Fair Value Gap) fill of imbalance
Previous demand area
Higher low formation area
This makes it a high probability retracement area for entering new long trades 👍.
📘 5. Short-term Outlook (Your Curved Path)
✔️ High probability move
Price may first touch resistance at 82–84
Then performs a liquidity pull (false breakout)
Retracing sharply back to the buyers' area 72–73 🟩
Before launching towards new highs if buyers defend that area.
This is a classic pattern:
Liquidity pull → deep retracement → continuation pattern 🔄
🎯 6. Key Levels to Watch
🔺 Resistance (Major Supply Area)
84–85 (Liquidity Gathering + Previous Rejection Area)
94–95 (Total Supply Target)
🟩 Support (Strong Demand Area)
72–73 (Buyers' Area — Ideal Entry Zone)
67–68 (Total Support)
📈 7. Summary — Professional Outlook
✨ Bullish if:
✔️ Price re-tests 72–73 and respects it
✔️ Breakout and close above 84
⚠️ Bearish if:
❌ Price breaks below 67
❌ Fails to maintain HL and re-enters the downtrend structure
📌 Final Point
🧭 The chart shows a transition from downtrend → accumulation → potential uptrend, but confirmation requires a breakout above 84 after the expected pullback.
The best long entry aligns with the buyers' area 72–73, targeting 84, then 95 if momentum supports.
✅ Trading here at $SOL
