
 Golden support analysis.
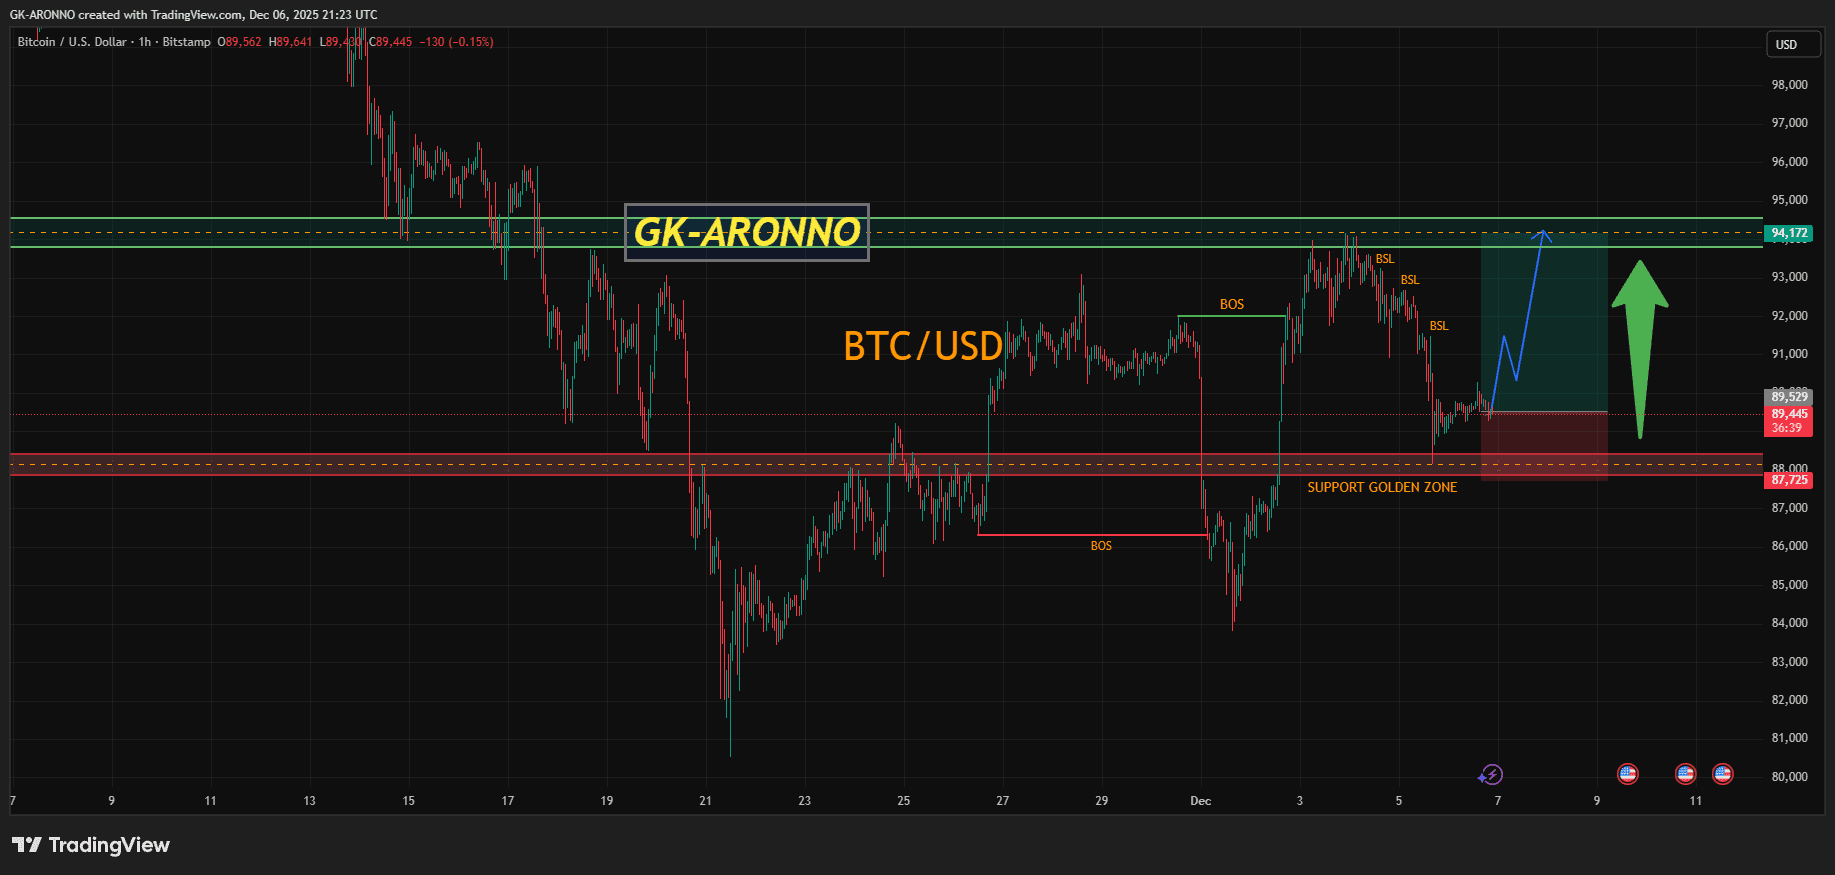
The hourly chart for BTC/USD highlights the potential for a continued bullish trend following a clear technical setup. The price experienced a significant pullback after reaching the resistance zone of $94,000 and absorbed buying side liquidity (BSL) above the recent highs. These declines have now found strong overlap in the defined "golden support zone," which extends approximately from $87,725 to $88,529. This area is critical as it coincides with previous turning points in price action and a high-volume trading area, indicating a strong foundation. The chart suggests that the current price level around $89,561 is a favorable entry point (represented by the red box), anticipating a rise. The main target for this trade is to re-test the $94,172 level, aiming for significant upward movement, as indicated by the large green arrow and the expected blue path, suggesting a high-probability long setup after successfully defending the support.
✅ Trade here on $BTC
