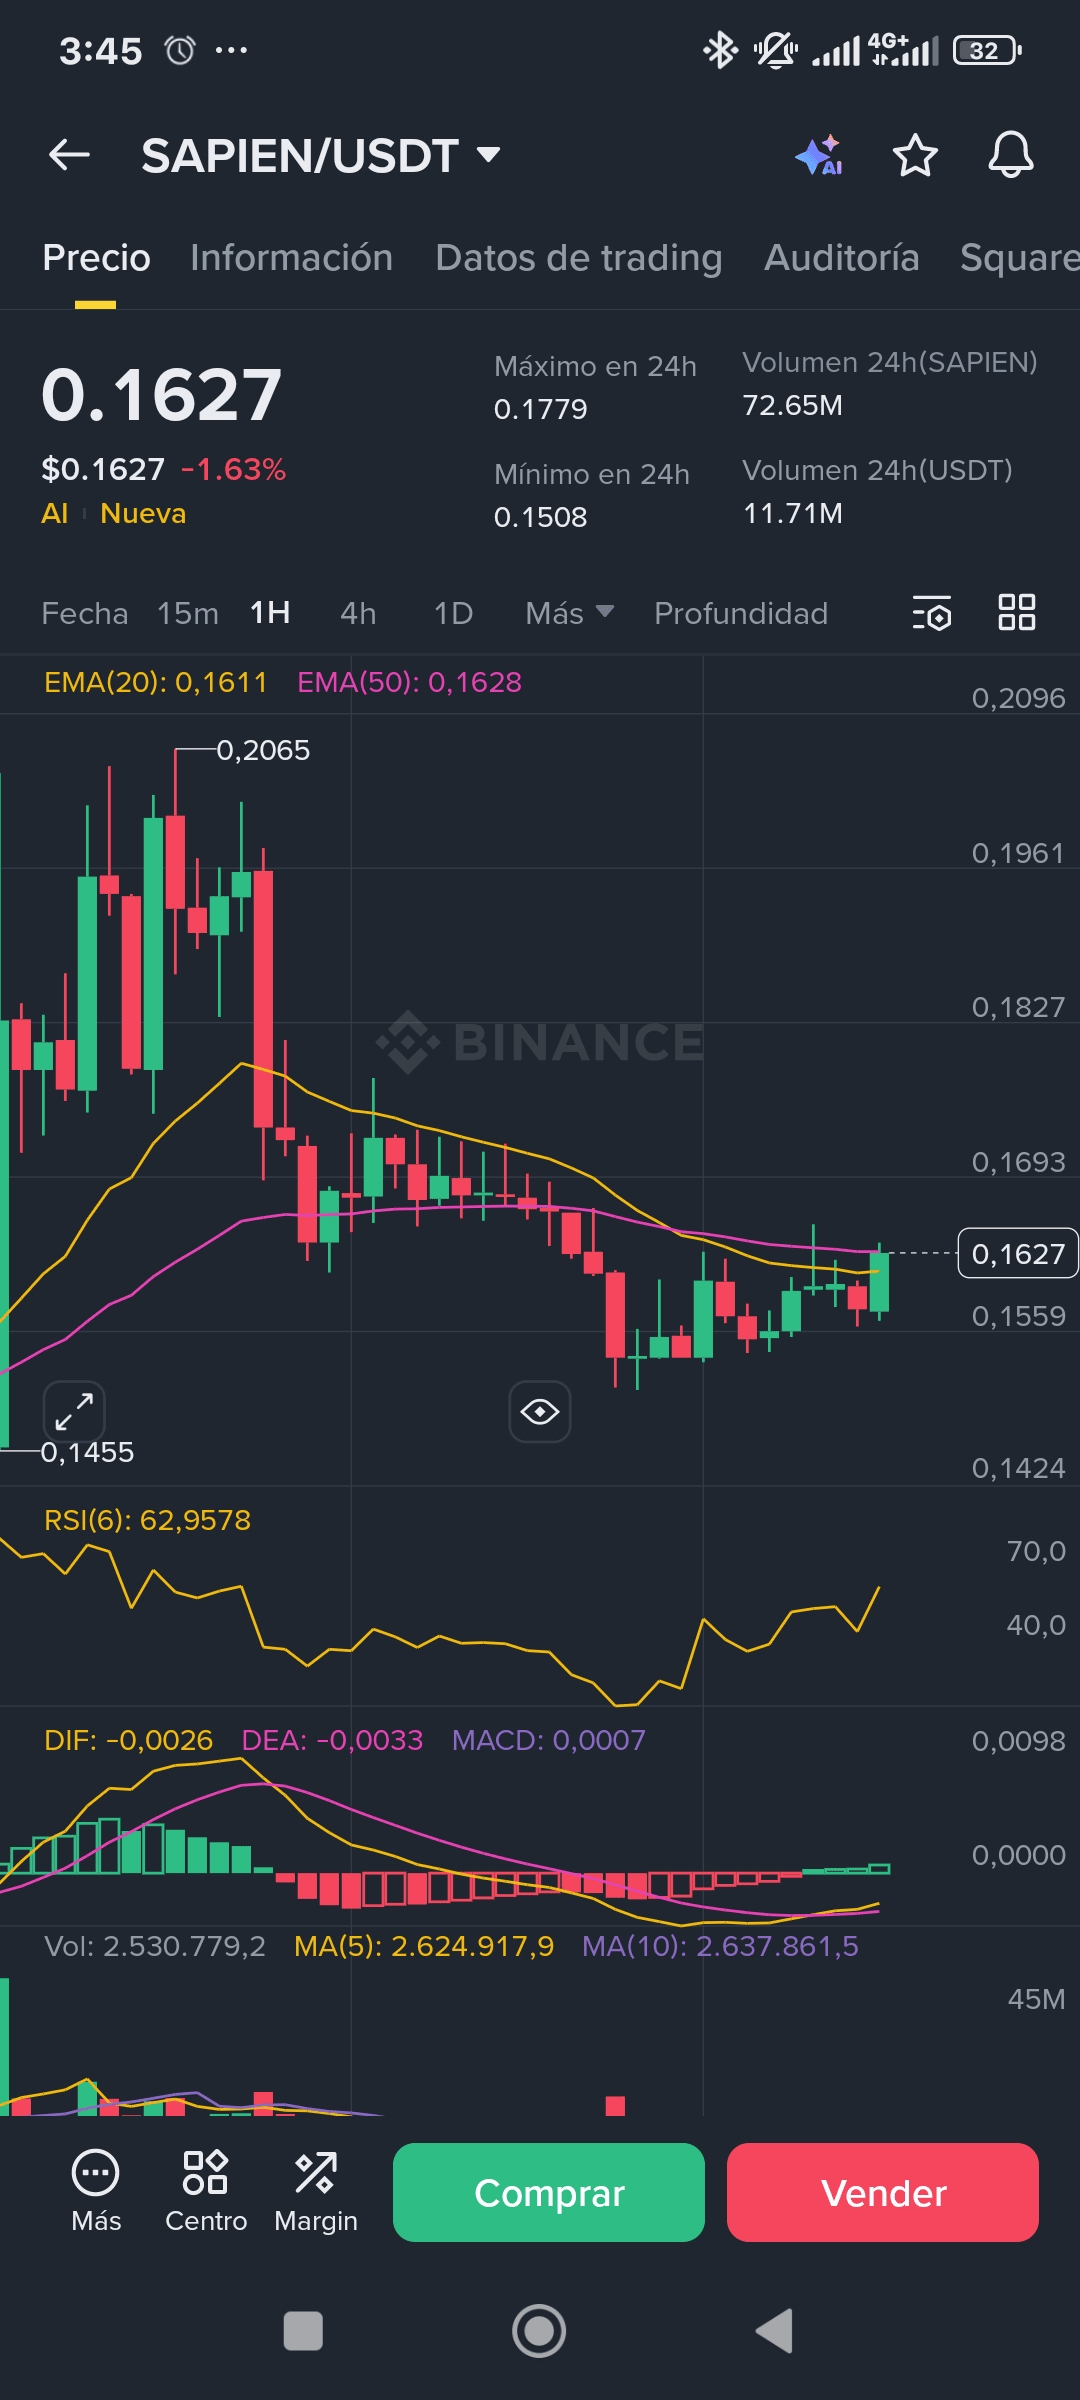
The pair $SAPIEN /USDT shows a price structure that suggests a possible short-term momentum change, despite recording a slight drop of -1.63% in the last day.
Key Points of Price Action:
Pivot in Moving Averages: The current price of $0.1627 is operating in a critical area, right at the convergence of the EMA(20) and the EMA(50). This indicates indecision in the market, where the EMA(20) ($0.1611) acts as support and the EMA(50) ($0.1628) as immediate resistance.
Strong Momentum: The relative strength index RSI (6) remains high at 62.95, indicating that the underlying bullish momentum is still present despite the consolidation.
Indicator Signals: $SAPIEN
MACD (Moving Average Convergence/Divergence): The MACD has generated a bullish crossover with a positive value of 0.0007. This is a key technical signal suggesting that selling pressure is decreasing and momentum could soon reverse towards the buying side.
Conclusion for Traders:
The key for $SAPIEN /USDT is to observe the breakout of the EMA(50) ($0.1628). A 1H candle closing decisively above this average and confirming the positive crossover of the MACD could validate an attempt to reverse towards the upper resistance levels, with the minimum of $0.1508 acting as the main support to defend.
#BinanceBlockchainWeek #SAPİEN #Binance #ScalpingTrading #SHORT📉