
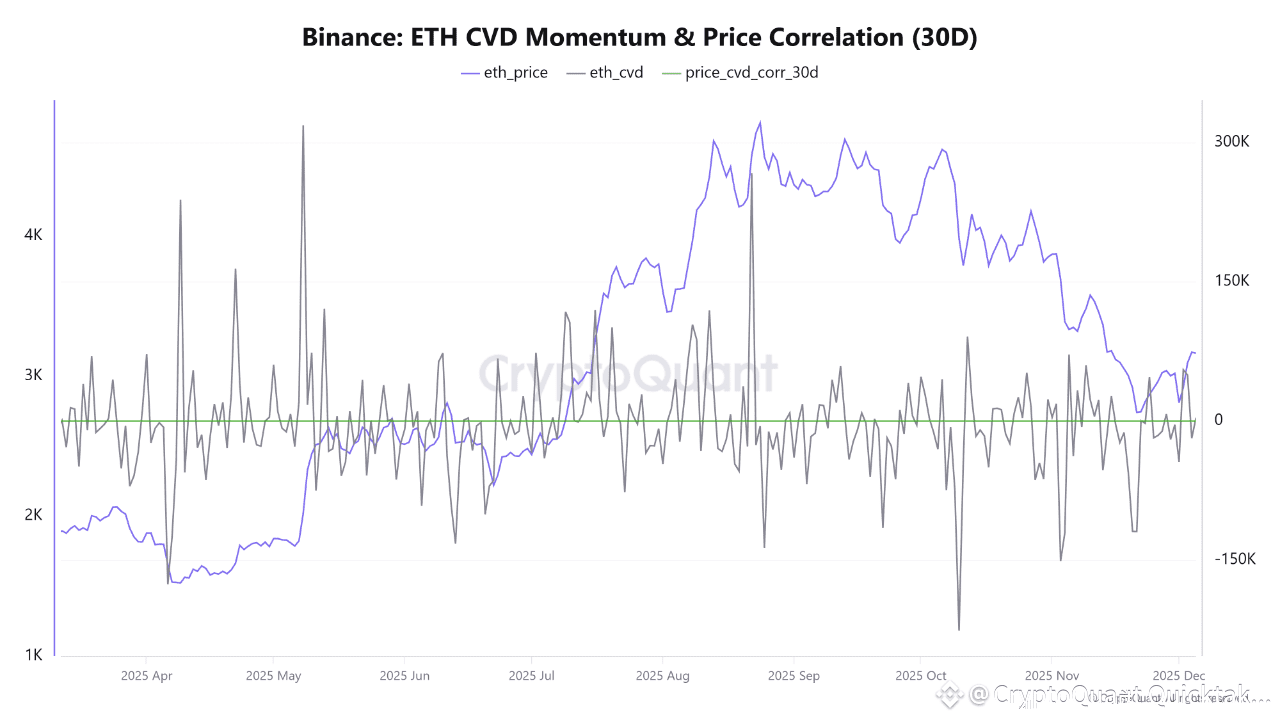
Ethereum data on Binance over the past few weeks shows a clear pattern of heightened volatility in the CVD indicator, reflecting rapid shifts in buying and selling pressure among traders. While the price remains in a downtrend from its peak in aug , recent CVD movements indicate the return of notable buying activity, although these movements are still sporadic and lack the consistency required to confirm a strong bullish reversal.
It is noteworthy that the CVD recently rose to positive levels, coinciding with the price’s attempt to stabilize above the $3,100 mark—a sign of new liquidity entering the market through short-term buy orders. However, the significant fluctuations within the CVD continue to signal a strong tug-of-war between buyers and sellers, with sharp spikes followed by rapid pullbacks, suggesting that the market has not yet reached a state of temporal or structural stability.
Equally important is the behavior of the 30-day correlation between price and CVD. Despite the relatively lower price levels, the correlation has remained positive around 0.6—a relatively high reading that highlights a consistent relationship between liquidity movements and price direction. The persistence of this positive correlation implies that buying pressure, even if intermittent, continues to play a meaningful role in shaping Ethereum’s medium-term price action.
this pattern can be interpreted as investors attempting to capitalize on market dips amid continued volatility, especially with growing anticipation of a potential liquidity influx as upcoming network upgrades approach. Nevertheless, the absence of a clear trend in the CVD suggests that any future upward movement will depend on the emergence of a more sustained accumulation phase and a reduction in short-term selling pressure.
Written by Arab Chain
