
Data analysts in the crypto market are continually keeping an eye on Dogecoin's moves, especially since a chart shared by a user on X (Twitter) indicated that $DOGE has been in a significant Accumulation Phase for a long time.
This post has drawn attention because it compared the current price pattern with those old patterns that preceded major moves in the market.
The shared chart shows three major Accumulation zones, and the current zone has been reported as the longest so far.
Additionally, the daily chart of Dogecoin also shows a continuous decline since the end of September.
These two signals have sparked discussions about the next Dogecoin Price Prediction in the market.
Recent Price Movement
According to the daily chart, DOGE has been continuously making Lower Highs and Lower Lows.
At this time, the token is trading at approximately $0.13, which is considered a major support zone.
First Resistance Zone: $0.15 – $0.16
This level is considered important in the short term.
Dogecoin Daily Chart
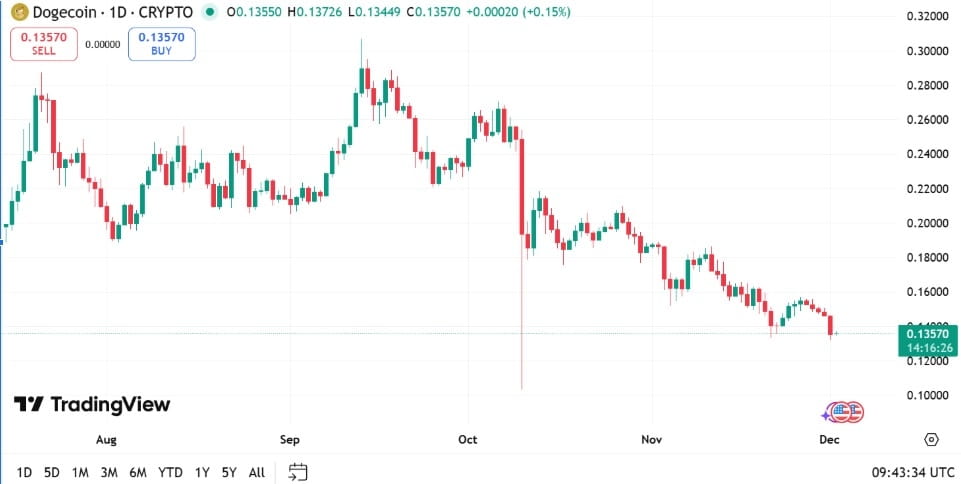
(Source: TradingView)
The decline from October's peak continued into November.
A long wick was also seen during a sharp sell-off in a day, but the market absorbed this move and the trend continued downward.
This makes it clear that the daily structure is still tilted toward a downtrend.
Different signals from the weekly chart
The weekly chart presents a completely different picture.
The chart shared by X user GalaxyBTC shows increasing Accumulation Levels over the past several years.
This pattern indicates that the base value of DOGE has consistently increased in each cycle.
After the previous Accumulation Phase shown in this chart, Dogecoin had significant rallies.
The current phase is considered the longest so far, increasing interest among long-term investors.
GalaxyBTC’s Chart
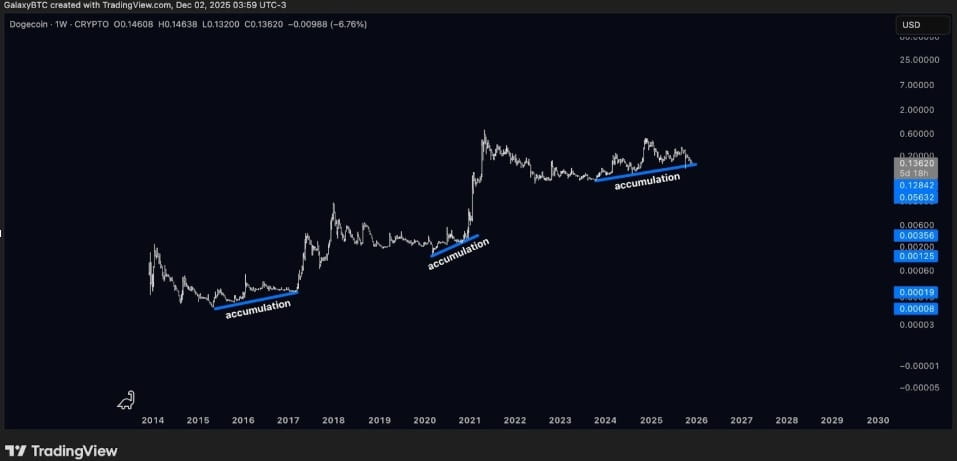
(Source: X/@galaxyBTC)
Support and Resistance Levels
Traders are currently monitoring these key levels:
Support Levels
$0.13 – $0.12: Nearest Support Zone
$0.10: Strong Historical Support
Resistance Levels
$0.15: First Major Resistance
Next target upon breaking above: $0.18 – $0.20
According to the crypto price structure, DOGE needs to create a Higher Low to change the trend.
But for now, the structure is still bearish.
Long-term Outlook
The Accumulation Chart shared by GalaxyBTC has brought new discussion to the market.
The rising base level on the weekly timeframe indicates that:
DOGE has been accumulated by strong hands for a long time
After such patterns in the previous cycle, Dogecoin had significant rallies
The market is currently watching whether this ongoing Accumulation Phase can lead to a similar significant rally.
The decline of the daily chart and the positive patterns of the weekly chart are both fueling further debate regarding the Dogecoin Price Prediction.
To Know More:- Crypto Hindi News
#CryptoHindiNews #india #BestCryptotoBuyNow #hindi

