Alright team, let's break down this juicy $XRP chart and see what's cooking. The long-awaited move for the 'Standard' is looking increasingly likely after a deep correction.
Technical Analysis
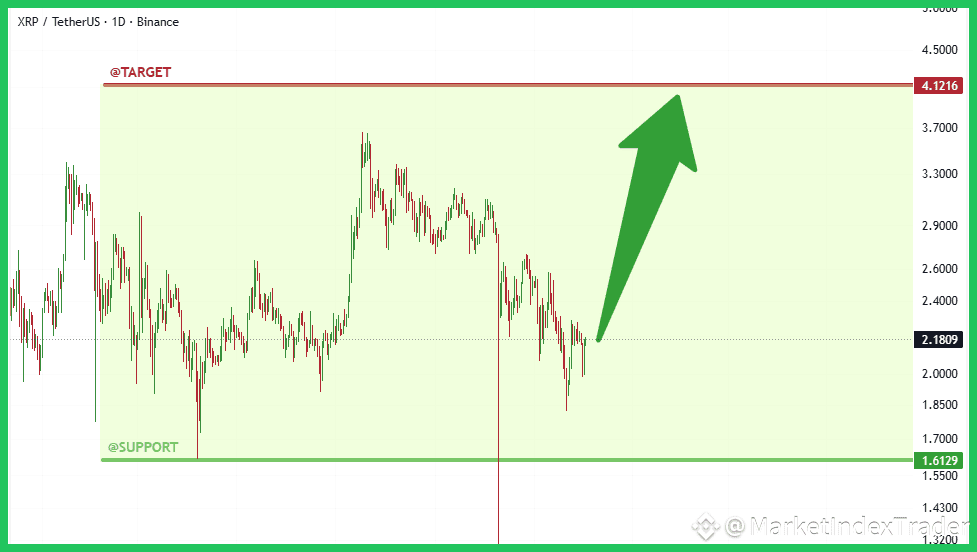
The Daily chart for $XRP/USDT confirms a strong bounce from the established long-term support zone at $1.61. This level has proven exceptionally resilient, suggesting massive accumulation is taking place. The current price action around $2.18 needs to consolidate before challenging overhead resistance. If current momentum holds, the ultimate technical target derived from this macro setup remains the major historical high at $4.1216.
Fundamentals Fueling the Move
On the fundamental side, Ripple continues to cement its role in global finance. Recent expansions in the APAC region and ongoing developments related to Central Bank Digital Currencies (CBDCs) utilizing the XRPL network provide massive real-world utility support. This sustained institutional traction fuels long-term bullish sentiment, complementing the strong technical structure.
Action Plan
We are firmly positioned for the next leg up. Holding above $2.00 is crucial for confirming the reversal structure. We believe this is a key accumulation period before the inevitable run towards previous cycle highs.
Highly recommend HOLD and Stacking $XRP at Binance
Feel free to comment the altcoin you are holding and we will check it for you!
#XRP #Ripple #TechnicalAnalysis #Crypto #BinanceSquare #Bitcoin #BullRun #XRPArmy


