Alright team, let's break down this juicy $BTC chart and see what's cooking on the macro weekly scale.

Technical Analysis
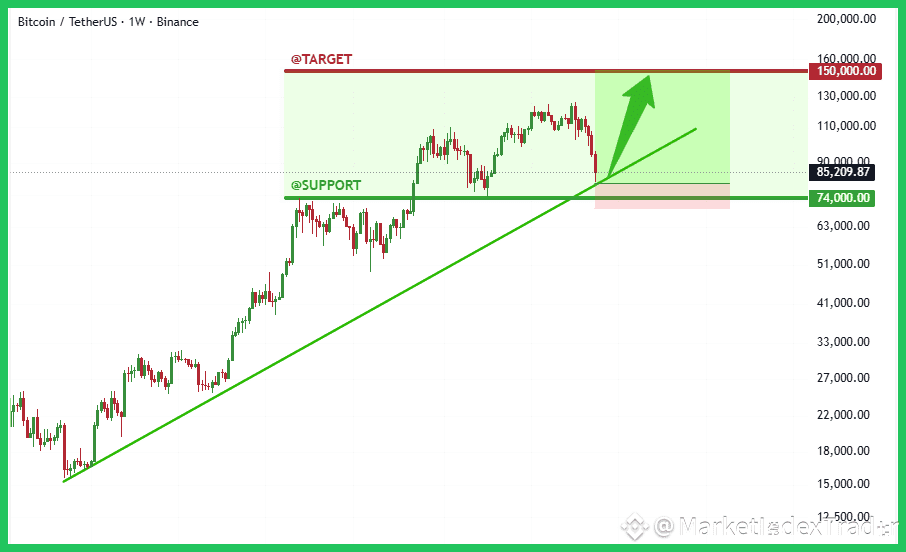
The recent, healthy pullback has brought Bitcoin to a massive confluence zone. The long-term diagonal trendline, which has supported the entire bull run since the lows, is now being tested, suggesting a high-probability reversal is due. Key support is located between $74,000 and $80,000. This area must hold to maintain the bullish structure. If bulls step in decisively here, the confirmation of the continuation pattern will target our primary resistance zone at $150,000.
Fundamental Tailwinds
Fundamentals remain stellar for Bitcoin. Institutional demand via US Spot ETFs continues to absorb supply at a high rate, reinforcing the post-Halving supply shock narrative. Additionally, increasing regulatory clarity in major jurisdictions and rapid growth in the Bitcoin Layer 2 ecosystem are driving significant utility and adoption.
Action Plan
This current price action looks like a textbook retest and shakeout before resuming the bull market. I view this $74k-$80k zone as a prime accumulation opportunity. Staying long with tight management below the support structure.
Highly recommend HOLD and Stacking $BTC at Binance
Feel free to comment the altcoin you are holding and we will check it for you!
#BTC #Bitcoin #Crypto #TechnicalAnalysis #BinanceSquare #HODL
