🎯 First: The idea of the strategy
The Fibonacci strategy is based on the principle that the market moves in waves, and after each strong movement (upward or downward), a corrective movement occurs before the trend continues.
Fibonacci ratios are used to identify potential support and resistance levels where the price may bounce back.
📏 Basic Fibonacci Ratios
The most commonly used ratios in trading are:
23.6%
38.2%
50%
61.8%
78.6%
The 61.8% level is the most important because it represents the "golden ratio" and often leads to a strong reversal.
🧭 Steps to apply the strategy
1. Identify the overall trend
Use moving averages (like 20 and 50) or peaks and troughs to determine the trend.
Example: If the peaks and troughs are rising → the trend is upward.
2. Draw the Fibonacci tool
In the uptrend: Place the tool from the trough to the peak.
In the downtrend: Place the tool from the peak to the trough.
3. Wait for the correction
After a strong movement, wait for the price to pull back to correct part of it.
The most precise levels for retracement are: 38.2% – 50% – 61.8%.
4. Confirm entry
Enter the trade only after a confirmation signal appears such as:
Reversal candle (engulfing, hammer, morning star...).
Divergence on the momentum indicator (like RSI or MACD).
Or break a small trend line in the opposite direction of the correction.
5. Set targets and stop loss
🎯 Target one: At the last peak (in the uptrend) or trough (in the downtrend).
🎯 Target two: Fibonacci extensions (like 161.8%).
⛔ Stop loss: Below the last low in the uptrend or above the last high in the downtrend.
💡 Professional tips
The greater the momentum with the original trend, the stronger the likelihood of trend continuation.
If momentum decreases and a candlestick pattern appears at one of the Fibonacci levels, a reversal often occurs.
Do not use Fibonacci alone — it is better to combine it with trend analysis, momentum, and candlestick patterns.
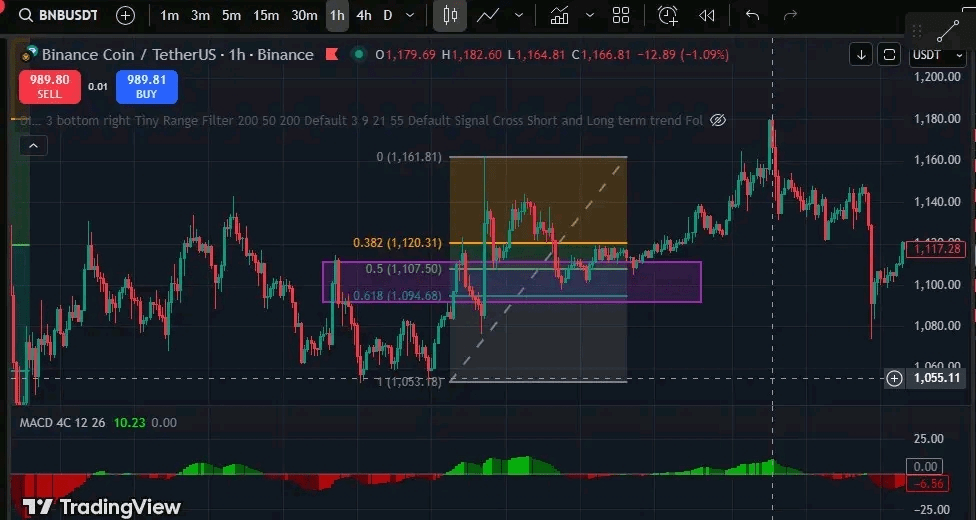
📊 Practical example
The trend is upward
Fibonacci is drawn from the trough to the last peak
The price corrects to the 61.8% level
A bullish engulfing candle appears
Buy entry
Target at the previous peak
Stop loss below the last low
#تعلم_التداول #Trading_Steps #Trading_Strategies #Successful_Trading #Market_Analysis #Trading_Lessons #متداول_عربي
#Economy #Investment #Trading_Tips #BinanceHODLerMorpho #شموع_يابانية #Market_Momentum #فيبوناتشي #Trading_Secrets
