
Key Summary
Rising volume at falling cost per unit of capability benefits hyperscaler infrastructure margins running at 33% to 38%.
Capital expenditure as a share of operating cash flow has moved from 41% in 2023 to roughly 105% in 2026. Aggregate free cash flow turned negative, funded by debt.
Markets now penalize spending without conversion and reward AI revenue growth.
Concentration is unwinding. Binance investors are broadening out of semiconductors into software and capital markets.
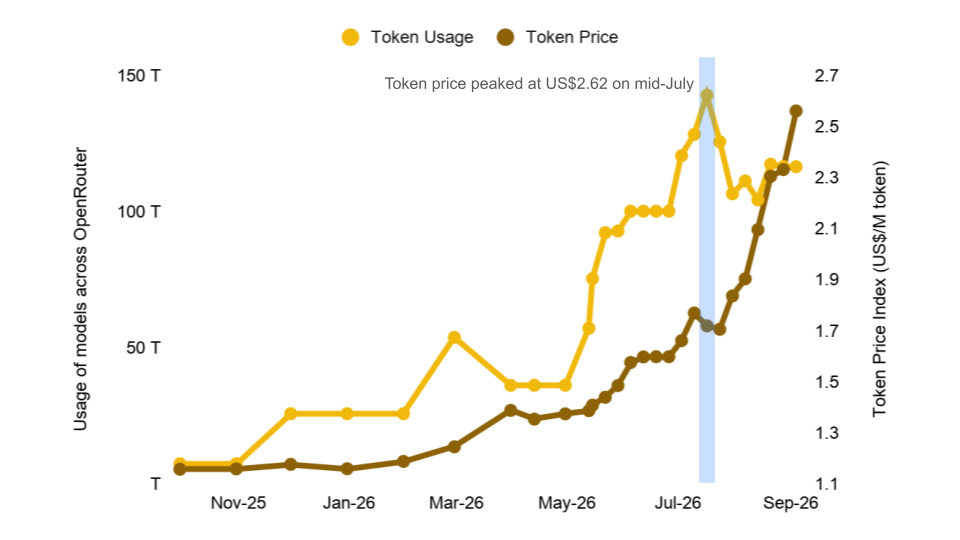
Token maxing ended in Q2, and the two curves now point in opposite directions
The second quarter ended the assumption that rising token consumption converts directly into model-layer revenue. Companies stopped chasing token maximization once it became clear that raw consumption is not linear to productivity. Agentic adoption grew quickly over the same period, and agents reward a different property: efficient token consumption per completed task. Frontier development shifted accordingly, away from pure reasoning benchmarks and toward agentic coding, memory architecture and cheaper flash-tier inference.
The volume data is unambiguous. Tokens routed through OpenRouter reached a weekly 137T in early September 2026, roughly 20 times higher compared to early 2026. Open-weight models crossed half of production inference tokens routed through the platform, up from a third in the prior OpenRouter study, and the five highest-volume models are now all open weight. At roughly 90% capability parity they cost about six times less per call. Stripe cut inference costs 73% while serving the same 50 million daily calls on a third of the GPU fleet.
The consequence is a split in who captures the growth. Enterprises now route by task, and cheap open-weight tokens are precisely what makes long-horizon agentic work economic, because an agent burns tokens in the thousands per task rather than the hundreds. Rising volume at falling cost per unit of capability benefits hyperscaler infrastructure margins running at 33% to 38%, and considerably harder for anyone selling the model itself.
Figure 1: Token usage climbed toward 150T as the price index peaked at US$2.62 in July
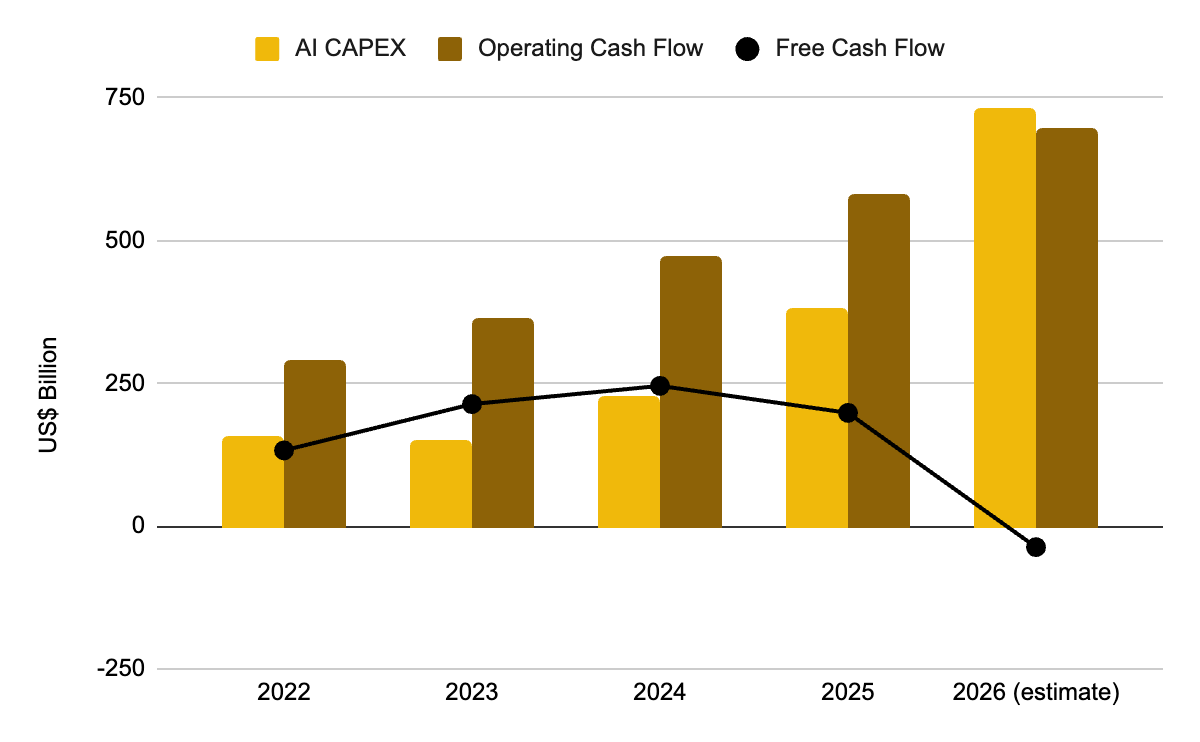
Capital expenditure crossed the cash flow line
Combined 2026 capital spending guidance across the largest US cloud operators now sits between US$725B and US$800B, depending on whether finance leases and prepayments are counted.
The absolute number matters less than the ratio behind it. Capital expenditure as a share of operating cash flow across the five has moved from 41% in 2023 to roughly 105% in 2026, meaning the group now spends more on capacity than its operations generate. The effect appeared immediately in free cash flow. Alphabet posted negative US$5.9B in the quarter, its first negative print since listing. Meta’s free cash flow fell to US$784M from US$8.5B a year earlier. Amazon ran negative US$7.6B on a trailing basis, and Oracle used US$23.7B across fiscal 2026. In aggregate the five swung from positive US$246B of free cash flow in 2024 to roughly negative US$37B in 2026, the first negative year of the cycle.
With internal cash exhausted, external financing has taken over. Debt as a share of hyperscaler capital spending rose from 9% in FY2024 to 32% over the twelve months to mid-2026, and aggregate group debt is around US$700B. The observation from the BIS worth noting is that spreads on AI private credit loans, at about 6.2 percentage points, are close to those charged to non-AI borrowers. Credit is not yet pricing what equity has already started to.
Figure 2: CAPEX overtakes operating cash flow in 2026 and free cash flow turns negative
The demand signal is enormous, but it is long-dated
Three companies, one pattern.
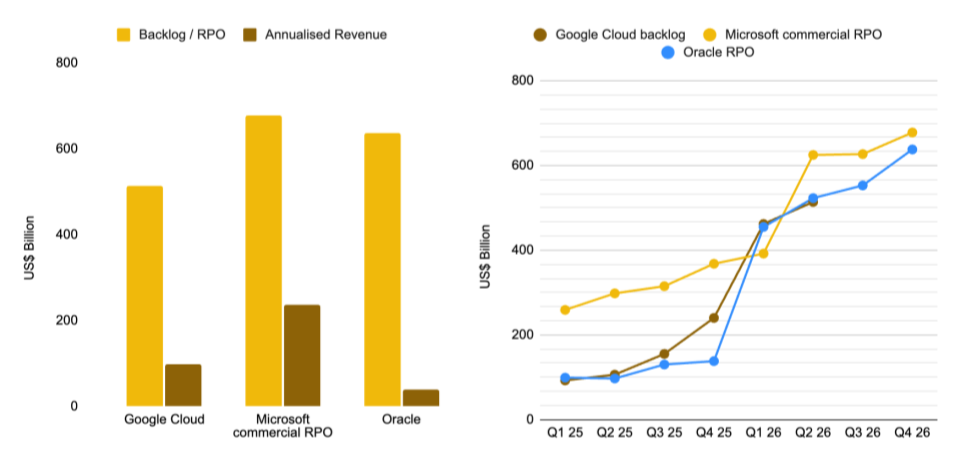
Google Cloud grew 82% to US$24.8B with operating margin at 35.6%, up from 20.7%, against a backlog of US$514B. It now processes 22 billion tokens per minute, up from 16 billion a quarter earlier.
Microsoft’s commercial remaining performance obligation reached US$678B, up 84%, with Azure growing 43% and Microsoft 365 Copilot passing 30 million paid seats.
Oracle’s RPO stands at US$638B, up 363%, but its own disclosure shows only about 12% converting within twelve months and roughly 20% beyond five years.
On the model side, Anthropic is at roughly US$65B annualized revenue and OpenAI around US$40B, both loss-making and both in the IPO queue. Goldman Sachs projects token consumption rising 24 times by 2030, while only 12% of knowledge workers use agentic AI by that date.
Every one of these numbers is genuinely large. Very few of them arrive quickly, and that gap is what the rest of this report turns on. The backlog is real and the capital spending is real, but hyperscalers and frontier labs now need to convert contracted demand into recognized revenue fast enough to justify the spend, against depreciation schedules on the underlying assets that run four to six years.
Figure 3: Backlog dwarfs current revenue: US$514B at Google Cloud, US$638B at Oracle
The market's reaction function has inverted
Investors are already applying these considerations, and the latest earnings season shows it clearly.
The aggregate statistics understate the shift, so the individual names lead. Across the index, positive EPS surprises were rewarded with an average gain of 0.6% against a five-year norm of 1.0%, and negative surprises fell 2.5% against a 3.0% norm. Muted in both directions, but not the whole story. Inside the AI complex the dispersion was violent.
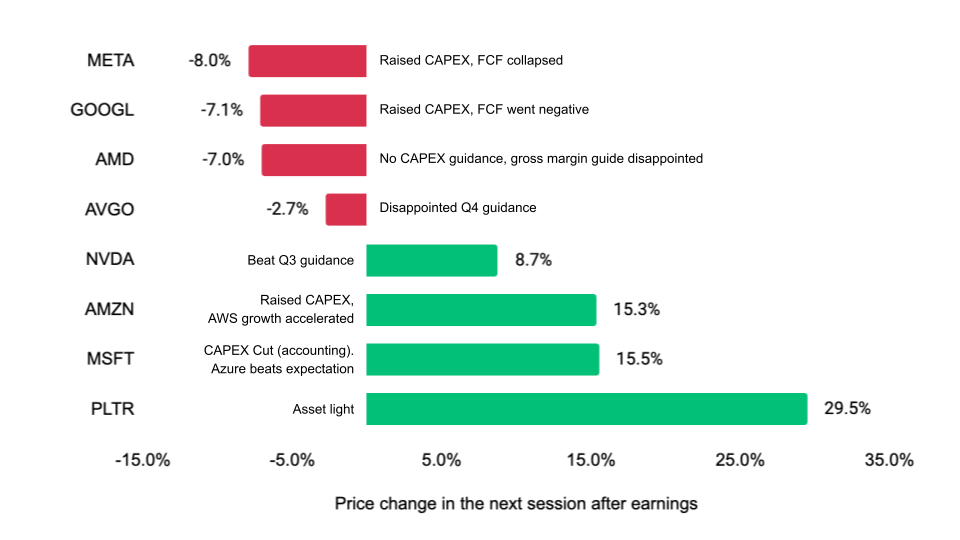
Measured on the first full session after each print, the split is clean. Alphabet grew revenue 24% and cloud 82% and still fell 7.13%, purely because it raised capital spending guidance. Meta fell 7.95% on an EPS miss compounded by another CAPEX raise and free cash flow of US$784M.
The other side is just as stark. Microsoft rose 15.51%, its largest one-day gain since 2008, on Azure at 43% and RPO up 84%, while nominally trimming calendar-2026 CAPEX. Amazon rose 15.32% and crossed US$3 trillion, having raised CAPEX to US$220B, because AWS reaccelerated to 37%. Nvidia rose 8.74%. Palantir, which spends almost nothing on capacity, rose 29.45%. The rule the market applied is simple. Spending is a liability unless it arrives with evidence of conversion, and the same CAPEX raise was penalized at Alphabet and rewarded at Amazon.
Figure 4: Same CAPEX raise, opposite outcomes: Alphabet fell 7.1%, Amazon rose 15.3%
2026 is a broadening year, not a narrowing one
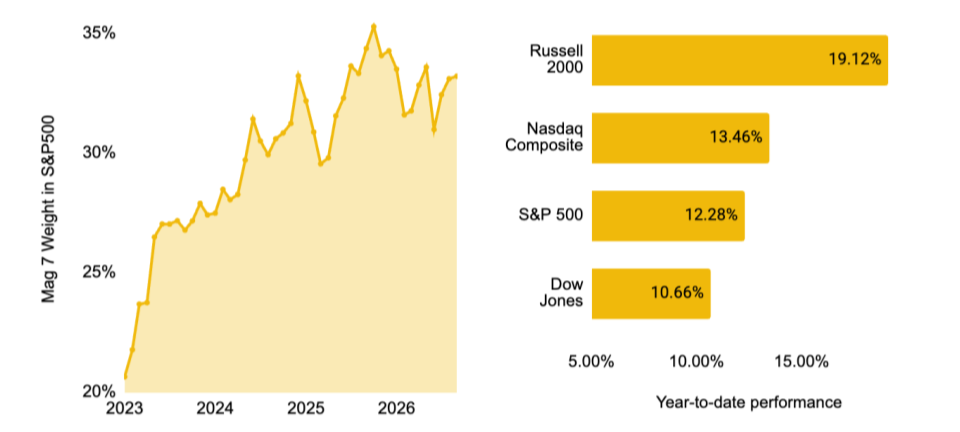
Concentration peaked and is now unwinding. The Magnificent Seven have slipped from about 35.3% in October 2025 to 33.2% in September 2026. Through August the S&P 500 is up 12.28% year to date, the Nasdaq Composite 13.46% and the Russell 2000 19.12%.
The small cap number is the one that matters. It suggests the AI trade is broadening into industrials, power and other second-order beneficiaries rather than narrowing further into megacap software. Equal weight is beating cap weight by about 3.6 points, which is what money arriving in higher-beta second derivatives looks like after the easy part of the move.
Valuation gives that rotation limited room. The index sits at a forward multiple of 19.6 times, marginally below the five-year average of 19.9 and above the ten-year average of 19.0. The discount rate is not helping either, with the effective federal funds rate at 3.63% and the ten-year Treasury yield at 4.77%. The practical conclusion has flipped since last year: 2026 is a broadening market, and the passive AI overweight is shrinking rather than growing.
Figure 5: Magnificent Seven weight rolls over while the Russell 2000 leads at 19.12% YTD
Binance investors are broadening too, from a far more concentrated base
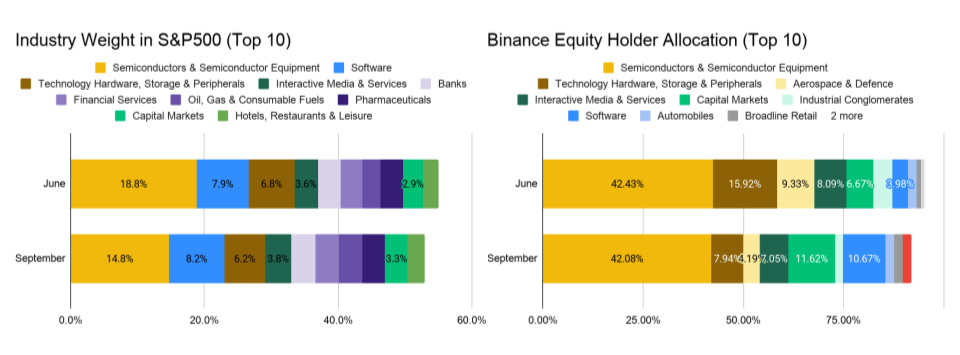
Two snapshots, one at the end of June 2026 and one on 4 September, show how index composition and Binance holdings moved over the same window.
Both moved the same way. Semiconductor weight in the S&P 500 fell from 18.8% to 14.8%, and technology hardware from 6.8% to 6.2%. Binance direct equity holders moved in the same direction and considerably harder, cutting technology hardware from 15.92% to 7.94%. Almost every other industry in the index gained weight slightly, which is what broadening looks like in practice: not a rotation into one replacement theme, but a general redistribution away from a single concentrated one.
Where the two diverge is in what replaced it. Binance holders continued to reduce aerospace and defence, interactive media and services, and industrials, while adding to capital markets, software and broader retail.
Three things separate the Binance investor from the benchmark. Semiconductor allocation is significantly overweight at 42.08%. Capital markets exposure reflects a crypto-adjacent preference the index does not share. And concentration is far higher: the top ten industries account for about 92% of Binance holder allocation, against roughly 53% for the top ten industries in the S&P 500.
Figure 6: Semiconductor weight fell in both the index and Binance holdings between June and September
Monthly flows show the rotation happening in real time
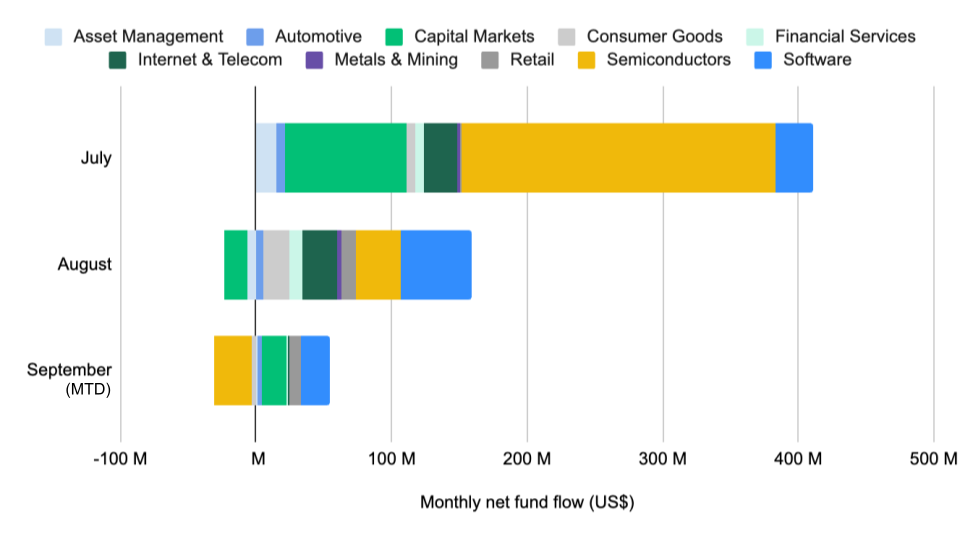
Monthly net fund flows reinforce the same broadening, and they date the shift in investor posture month by month.
In July, investors were still positioned for the AI trade and optimistic going into earnings, with most buying the late-July dip. Semiconductors absorbed the majority of net inflow, alongside capital markets.
August was more cautious. Investors took profit in capital markets names, continued to add to semiconductors but at a materially lower rate, and rotated meaningfully into software. Total net flow roughly halved.
September to date shows the first monthly net outflow from semiconductors of the period, as higher long-term yields weighed on risk assets. The caveat is important: this covers only the first week of the month, and the upcoming Federal Reserve rate decision could reverse it quickly.
Read together, the three months describe a book that began the quarter concentrated in the AI hardware complex and ended it distributing into software, capital markets and second-order beneficiaries. That is the same movement visible in the index, arriving through a different investor base and at greater speed.
Figure 7: Net flows rotate out of semiconductors and into software across July to September
Trading volume tracks what investors already hold
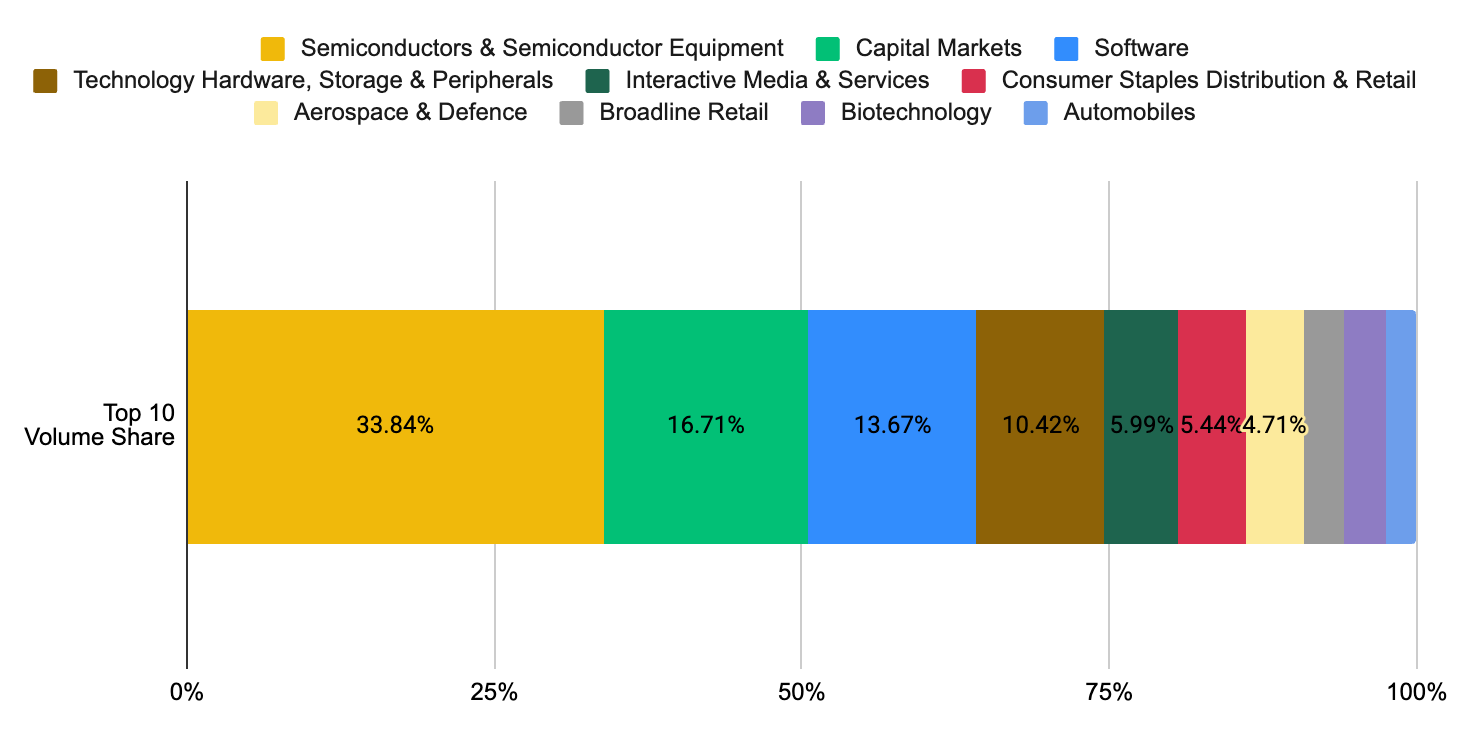
Trading activity closely mirrors the allocation picture. The top ten industries by volume share correspond to the industries Binance investors hold, which points to position-building rather than short-horizon rotation between unrelated themes.
Semiconductors led September volume at 33.84%, followed by capital markets at 16.71% and software at 13.67%. Those three account for just under two thirds of all volume across the top ten. Technology hardware follows at 10.42%, consistent with the reduction in holdings described above.
The alignment between what is held and what is traded matters for reading the flow data. Where volume concentrates in the same industries investors are accumulating, flows are more likely to reflect conviction than churn.
Figure 8: Semiconductors, capital markets and software take 64% of September trading volume
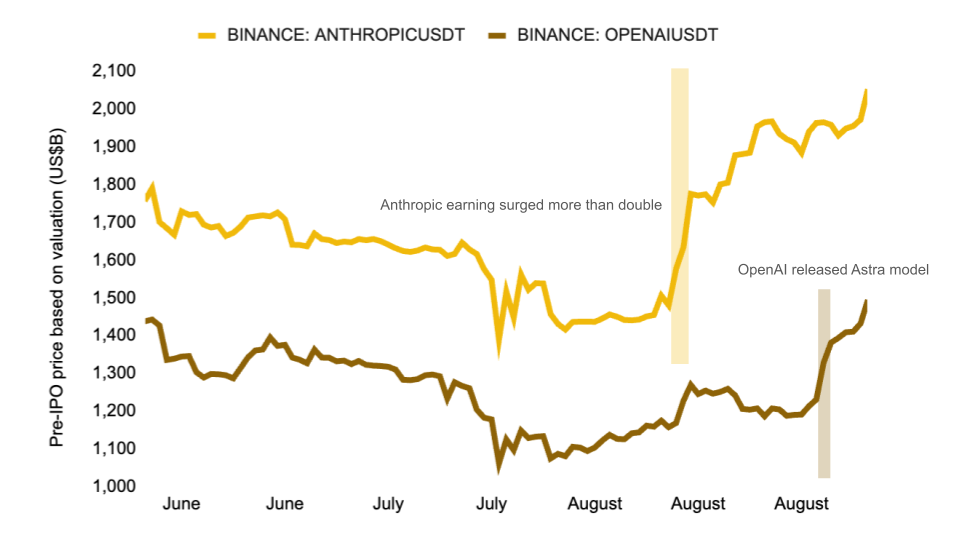
Pre-IPO perpetuals price the counterparty risk directly
Pre-IPO perpetuals on Binance let investors take a position on private company valuations not available on other major platforms. Both relevant names re-priced on news during the period. Anthropic rose roughly 35% across August after reporting that quarterly revenue more than doubled, alongside a small positive operating profit. OpenAI gained around 23% in early September following the release of its latest frontier model, Astra, a direct and immediate market judgment on a model launch.
That matters well beyond the trade itself, because these two companies sit underneath a large share of hyperscaler AI revenue. Wells Fargo puts 70% or more of Microsoft’s AI revenue with the two labs. Barclays estimates 73% of Amazon’s. UBS has them at 28% of total Google Cloud revenue in 2026, rising above 48% in 2027. Oracle’s US$300B OpenAI contract is roughly half of its US$638B backlog.
The concentration is therefore tighter than the headline capital spending figures suggest, and it is concentrated in two private counterparties rather than across a diversified customer base. A material slowdown at either lab would travel back through hyperscaler AI revenue, then Oracle’s backlog, then the vendor-backstopped securitizations that financed the capacity. Pre-IPO perpetuals are currently among the few instruments that let an investor hedge that specific exposure directly.
Figure 9: Anthropic and OpenAI pre-IPO prices reprice on earnings and the Astra launch
GENERAL DISCLOSURE: This material is prepared by Binance Research and is not intended to be relied upon as a forecast or investment advice, and is not a recommendation, offer or solicitation to buy or sell any securities, cryptocurrencies or to adopt any investment strategy. The use of terminology and the views expressed are intended to promote understanding and the responsible development of the sector and should not be interpreted as definitive legal views or those of Binance. The opinions expressed are as of the date shown above and are the opinions of the writer, they may change as subsequent conditions vary. The information and opinions contained in this material are derived from proprietary and non-proprietary sources deemed by Binance Research to be reliable, are not necessarily all-inclusive and are not guaranteed as to accuracy. As such, no warranty of accuracy or reliability is given and no responsibility arising in any other way for errors and omissions (including responsibility to any person by reason of negligence) is accepted by Binance. This material may contain ’forward looking’ information that is not purely historical in nature. Such information may include, among other things, projections and forecasts. There is no guarantee that any forecasts made will come to pass. Reliance upon information in this material is at the sole discretion of the reader. This material is intended for information purposes only and does not constitute investment advice or an offer or solicitation to purchase or sell in any securities, cryptocurrencies or any investment strategy nor shall any securities or cryptocurrency be offered or sold to any person in any jurisdiction in which an offer, solicitation, purchase or sale would be unlawful under the laws of such jurisdiction. Investment involves risks. For more information, see our Terms of Use and Risk Warning.