For more than a century, residential real estate followed a remarkably predictable pattern.
Home prices tracked inflation, income growth, and population expansion. Cycles existed, but they were shallow, slow, and self-correcting. Housing was boring — and boring is what makes a market healthy.
That stability ended permanently in the mid-2000s.
📉 The First Warning: 2006
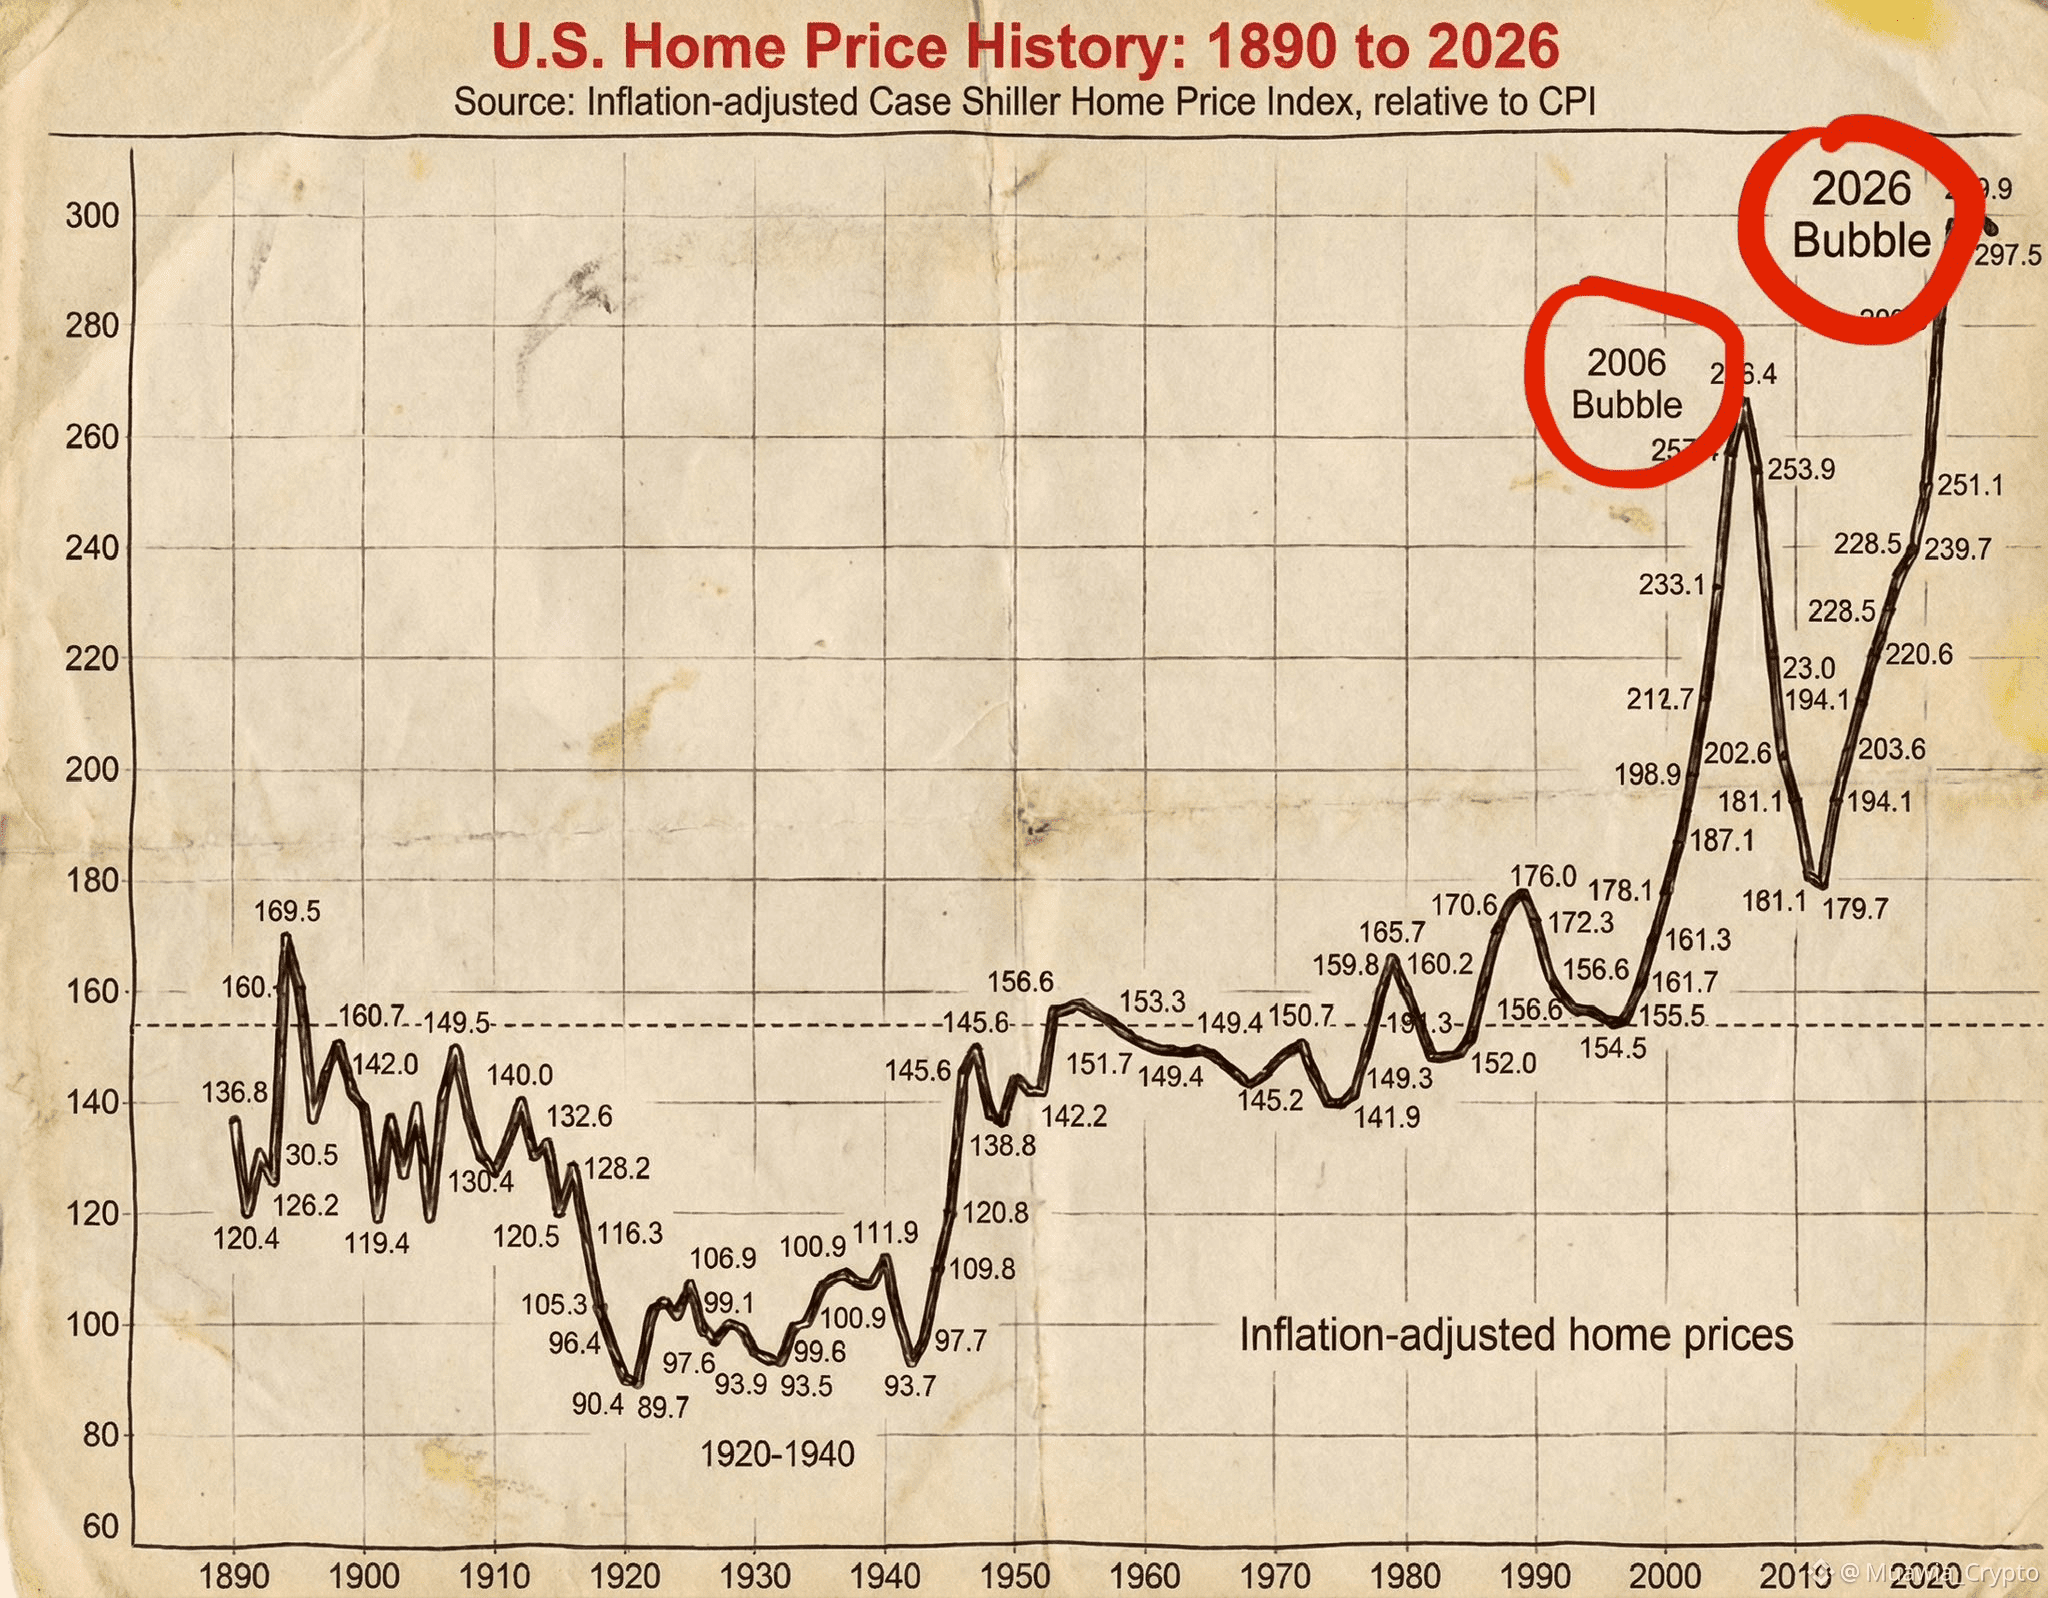
In 2006, the U.S. housing index reached 266.4, a level that fundamentally detached from historical valuation norms.
What followed wasn’t a “dip” — it was a near-collapse of the global financial system.
Banks failed. Liquidity froze. Governments intervened.
That period was later labeled a bubble.
📊 The Reality No One Wants to Acknowledge
Fast-forward to today.
We are now sitting just below 300 on the same index.
Let that sink in.
This means the current valuation exceeds the 2006 extreme, despite:
Slower real wage growth
Higher debt saturation
Demographic headwinds
The highest mortgage rates in decades
Calling this “appreciation” is mathematically dishonest.
This is not organic price discovery.
This is engineered price inflation.
🧠 This Was a Liquidity Event, Not a Housing Boom
What occurred over the last few years was not demand-driven growth — it was a liquidity trap.
Cheap debt flooded the system.
Rates were suppressed.
Leverage became normalized.
Retail families were herded into bidding wars, psychologically pressured by narratives like:
“Buy now or be priced out forever”
“Real estate never goes down”
Meanwhile, institutional capital behaved very differently.
Smart money didn’t chase — it distributed.
🔍 The Fundamentals Tell the Truth (They Always Do)
If you strip away sentiment and media narratives, the data is brutally clear:
Housing affordability is at all-time lows
The gap between median wages and monthly mortgage payments has never been wider
Down payment requirements are rising while savings rates are falling
Transaction volume is collapsing — a classic late-cycle signal
In simple terms:
The bid beneath this market is gone.
Prices are being “maintained” — not supported.
⚙️ How the Asset Transfer Mechanism Works
This cycle follows a textbook playbook:
Suppress interest rates to inflate asset values
Trigger FOMO through scarcity narratives
Push households into maximum leverage
Remove liquidity
Let gravity do the rest
The result is always the same: Assets migrate from overleveraged, impatient participants to liquid, patient capital.
This isn’t a conspiracy.
It’s how financial systems clear excess.
⛔ Where We Are Now
We are hovering near 297.5 — historically a terminal zone.
Inventory is quietly rebuilding
Buyer exhaustion is visible in data
Credit sensitivity is rising
Short exposure is increasing
This is not a bottoming process.
This is distribution.
Just like in 2006, the chart doesn’t need predictions — it needs respect.
🧲 Gravity Has Never Lost
Every attempt to defy valuation eventually fails.
Not because of emotion.
Not because of headlines.
But because math always wins.
This system is not designed to protect participants — it is designed to reallocate assets efficiently.
And right now, the trap is already closed.
Final Word
Is this sustainable? No.
Is a correction coming? Yes — inevitably.
I’ve spent over a decade studying cycles, liquidity flows, and market psychology.
Major tops and bottoms are not random — they are telegraphed.
When my next strategic move is complete, I’ll share it publicly.
If you’re not paying attention now, you’ll understand later —
when hindsight becomes painfully clear.
#BTC #bitcoin #BinanceSquareBTC