— 𝐌𝐚𝐫𝐤𝐞𝐭 𝐈𝐬 𝐬𝐞𝐭 𝐭𝐨 𝐄𝐱𝐩𝐥𝐨𝐝𝐞 🚀🔥
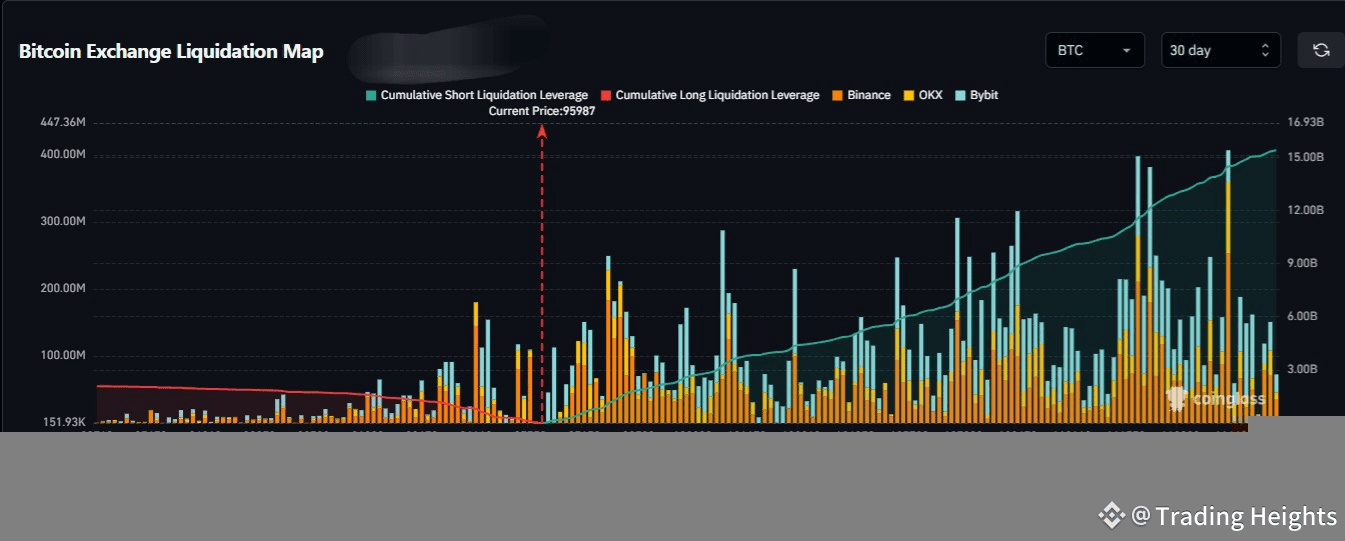
The latest #Bitcoin Exchange Liquidation Map reveals a massively asymmetrical pressure zone — and the imbalance is heavily tilted toward a bullish breakout.
Here’s the real picture the market is hiding 👇
𝐖𝐡𝐚𝐭 𝐭𝐡𝐞 𝐌𝐚𝐩 𝐑𝐞𝐚𝐥𝐥𝐲 𝐓𝐞𝐥𝐥𝐬 𝐔𝐬 📊
◆ 🔶 𝐒𝐡𝐨𝐫𝐭 𝐥𝐢𝐪𝐮𝐢𝐝𝐚𝐭𝐢𝐨𝐧 𝐜𝐥𝐮𝐬𝐭𝐞𝐫𝐬 𝐚𝐫𝐞 𝐝𝐨𝐦𝐢𝐧𝐚𝐭𝐢𝐧𝐠 𝐭𝐡𝐞 𝐜𝐡𝐚𝐫𝐭 — 𝐚 𝐛𝐮𝐥𝐥𝐢𝐬𝐡 𝐩𝐨𝐰𝐞𝐫 𝐚𝐜𝐜𝐮𝐦𝐮𝐥𝐚𝐭𝐢𝐨𝐧.
A 15% BTC pump triggers $𝟏𝟎,𝟏𝟒𝟎,𝟎𝟎𝟎,𝟎𝟎𝟎 in forced short liquidations — the fuel required for a mega-short squeeze.
◆ 🔶 𝐋𝐨𝐧𝐠 𝐥𝐢𝐪𝐮𝐢𝐝𝐚𝐭𝐢𝐨𝐧 𝐳𝐨𝐧𝐞𝐬 𝐚𝐫𝐞 𝐬𝐦𝐚𝐥𝐥𝐞𝐫 𝐚𝐧𝐝 𝐥𝐞𝐬𝐬 𝐝𝐞𝐧𝐬𝐞.
A 15% dump only risks $𝟐.𝟓𝐁 in long liquidations — meaning downside pressure is weak compared to upside momentum.
◆ 🔶 𝐄𝐱𝐜𝐡𝐚𝐧𝐠𝐞𝐬 𝐚𝐫𝐞 𝐥𝐨𝐚𝐝𝐞𝐝 𝐰𝐢𝐭𝐡 𝐭𝐫𝐚𝐩𝐩𝐞𝐝 𝐬𝐡𝐨𝐫𝐭𝐬.
Binance, OKX, and Bybit collectively show multi-billion leverage pockets above current price.
Once BTC climbs into these pockets → cascade of buy orders.
𝐖𝐡𝐲 𝐓𝐡𝐢𝐬 𝐒𝐞𝐭𝐮𝐩 𝐈𝐬 𝐁𝐮𝐥𝐥𝐢𝐬𝐡 🚀📈
◆ 🔶 𝐒𝐡𝐨𝐫𝐭 𝐬𝐢𝐝𝐞 𝐥𝐢𝐪𝐮𝐢𝐝𝐚𝐭𝐢𝐨𝐧 𝐟𝐫𝐞𝐧𝐳𝐲 𝐢𝐬 𝟒× 𝐛𝐢𝐠𝐠𝐞𝐫 𝐭𝐡𝐚𝐧 𝐥𝐨𝐧𝐠𝐬.
This creates a directional bias — upside moves trigger explosive short squeezes, while downside moves stay limited.
◆ 🔶 𝐖𝐡𝐚𝐥𝐞𝐬 𝐟𝐫𝐨𝐦 𝐨𝐦𝐧𝐢-𝐞𝐱𝐜𝐡𝐚𝐧𝐠𝐞𝐬 𝐜𝐚𝐧 𝐮𝐬𝐞 𝐭𝐡𝐢𝐬 𝐢𝐦𝐛𝐚𝐥𝐚𝐧𝐜𝐞.
Smart money typically drives price into liquidation pockets to harvest liquidity — and right now the largest pockets are above the current level.
◆ 🔶 𝐁𝐭𝐜 𝐢𝐬 𝐬𝐢𝐭𝐭𝐢𝐧𝐠 𝐣𝐮𝐬𝐭 𝐛𝐞𝐥𝐨𝐰 𝐭𝐡𝐞 𝐦𝐨𝐬𝐭 𝐝𝐚𝐧𝐠𝐞𝐫𝐨𝐮𝐬 𝐬𝐡𝐨𝐫𝐭 𝐳𝐨𝐧𝐞.
One clean breakout can unleash billions in liquidations — price can overshoot easily once the dominoes start falling.
𝐓𝐫𝐚𝐝𝐢𝐧𝐠 𝐇𝐞𝐢𝐠𝐡𝐭𝐬™ 𝐕𝐞𝐫𝐝𝐢𝐜𝐭 🔥📌
◆ 🔶 𝐔𝐩𝐬𝐢𝐝𝐞 𝐢𝐬 𝐬𝐮𝐩𝐞𝐫-𝐜𝐡𝐚𝐫𝐠𝐞𝐝.
With $𝟏𝟎.𝟏𝟒𝐁 in short liquidations stacked above price, the next impulsive wave can trigger an unprecedented squeeze.
◆ 🔶 𝐃𝐨𝐰𝐧𝐬𝐢𝐝𝐞 𝐫𝐢𝐬𝐤 𝐢𝐬 𝐫𝐞𝐥𝐚𝐭𝐢𝐯𝐞𝐥𝐲 𝐥𝐢𝐠𝐡𝐭.
Only $𝟐.𝟓𝐁 in long liquidations means bears have limited destruction potential.
◆ 🔶 𝐌𝐚𝐫𝐤𝐞𝐭 𝐛𝐢𝐚𝐬 = 𝐁𝐮𝐥𝐥𝐢𝐬𝐡.
Until BTC breaks key support, the structure favors a short-side wipeout rally.
📈 One 15% push can ignite one of the biggest short squeezes of the quarter.
Stay prepared — volatility will not wait.