$SPACE Gona Be Huge @CZ @Richard Teng $BNB
Here's the professional technical analysis and bullish post, fully in English, based on your new chart.
---
📊 Professional Technical Analysis: SPACEUSDT.P
Market: SPACEUSDT.P (Perpetual Futures)
Timeframe: Monthly View (February – July 2026)
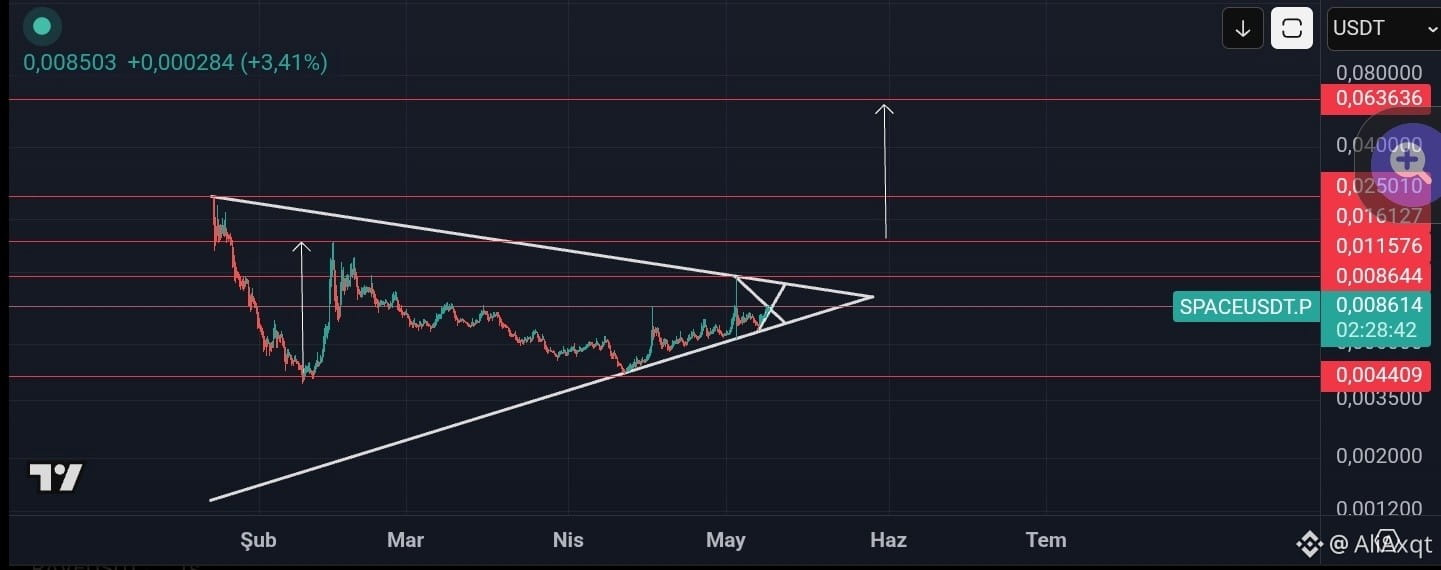
Current Price: 0.008503 USD (+3.41%)
Key Levels: 0.008644 — 0.011576 — 0.016127 — 0.025010 — 0.040006 — 0.063636 — 0.080000
Chart Interpretation:
1. Cycle Bottom & Accumulation
The decline from the February zone down to the range of 0.004409 → 0.001200 marks the final exhaustion of sellers. The subsequent recovery back to 0.0085 shows that a strong accumulation base has formed. Holding above 0.0044 on a monthly closing basis solidifies this as a cyclical bottom.
2. Fibonacci Stacked Resistance
The pre-plotted levels (0.008644, 0.011576, 0.016127, etc.) form a clear Fibonacci extension ladder. The 0.008644 level very likely aligns with the 50%–61.8% retracement of the previous decline. Price is now pressing right beneath this first gate, with the +3.41% daily move signaling bullish intent.
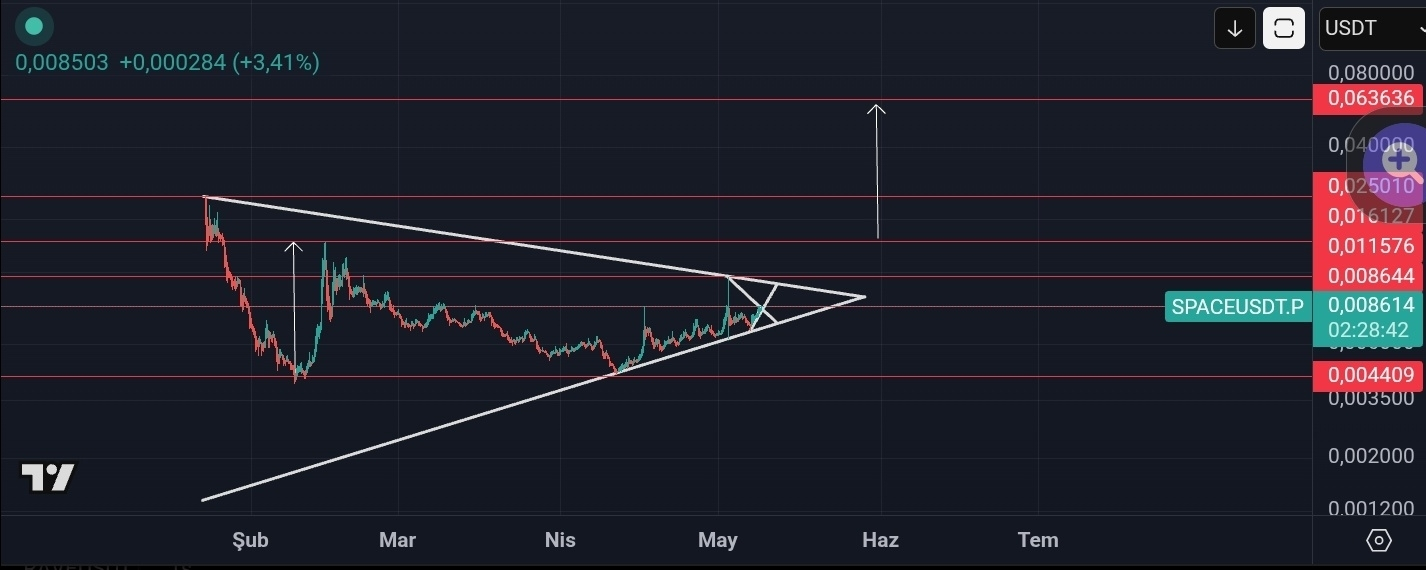
3. Inverse Head & Shoulders Pattern
From February to July, the structure strongly resembles an Inverse Head & Shoulders:
· Left shoulder: ~0.0085
· Head: ~0.0044
· Right shoulder: ~0.0085 (forming now)
A breakout above the neckline at 0.008644 targets the measured move zone of 0.013 – 0.016, precisely matching the second set of resistances (0.011576 and 0.016127).
4. Potential Roadmap
· Phase 1: Daily/weekly close above 0.008644 → Confirms the IH&S.
· Phase 2: 0.011576 – 0.016127 → Primary pattern target.
· Phase 3: 0.025010 → 1.618 Fibonacci extension, a major mid-term resistance.
· Phase 4 (long-term): 0.040006+ → Aligns with the previously identified “Cup & Handle” grand target.
5. Risk Management
Invalidation remains below the 0.004409 cycle low. A shorter-term cautious signal would be a daily close back under 0.0070. The current structure offers a highly asymmetric risk/reward ratio in favor of bulls.
Summary:
SPACEUSDT has absorbed months of selling and built a prolonged base. Price is now pressing against the first critical resistance. Each listed level acts as a step; breaking them sequentially would signal accelerating bullish momentum. The +3.41% daily surge hints that the compression is about to resolve upward.
---
🐂 Professional Bullish Post for X (Twitter)
$SPACE is coiled right below the birth of a new trend. 👀
🕯️ What the chart says:
A multi-month base, a clear cycle low at $0.0044, and now price has reclaimed $0.0085. From Feb to July, an Inverse Head & Shoulders pattern has finished shaping — and it’s pinned right at the neckline ($0.008644).
Breakout confirmed? The measured targets step straight to **$0.0115 → $0.0161 → $0.0250**.
🌟 Why now?
• +3.41% today — buyers are already leaning in.
• A weekly close above $0.008644 confirms the macro trend change.
• Exhausted sellers, fresh accumulation — the math favors early bulls.
📌 Levels to hardcode:
🔹 Resistance: $0.00864 / $0.01157 / $0.01612
🔹 Support/Invalidation: $0.00440
The footsteps are getting louder. The second wave of the cycle quietly starts here. 🚀
#Spacecoin #Space #Crypto #Bullish #TechnicalAnalysis #AltcoinGem
#bitcoin #Binance #Whale.Alert