
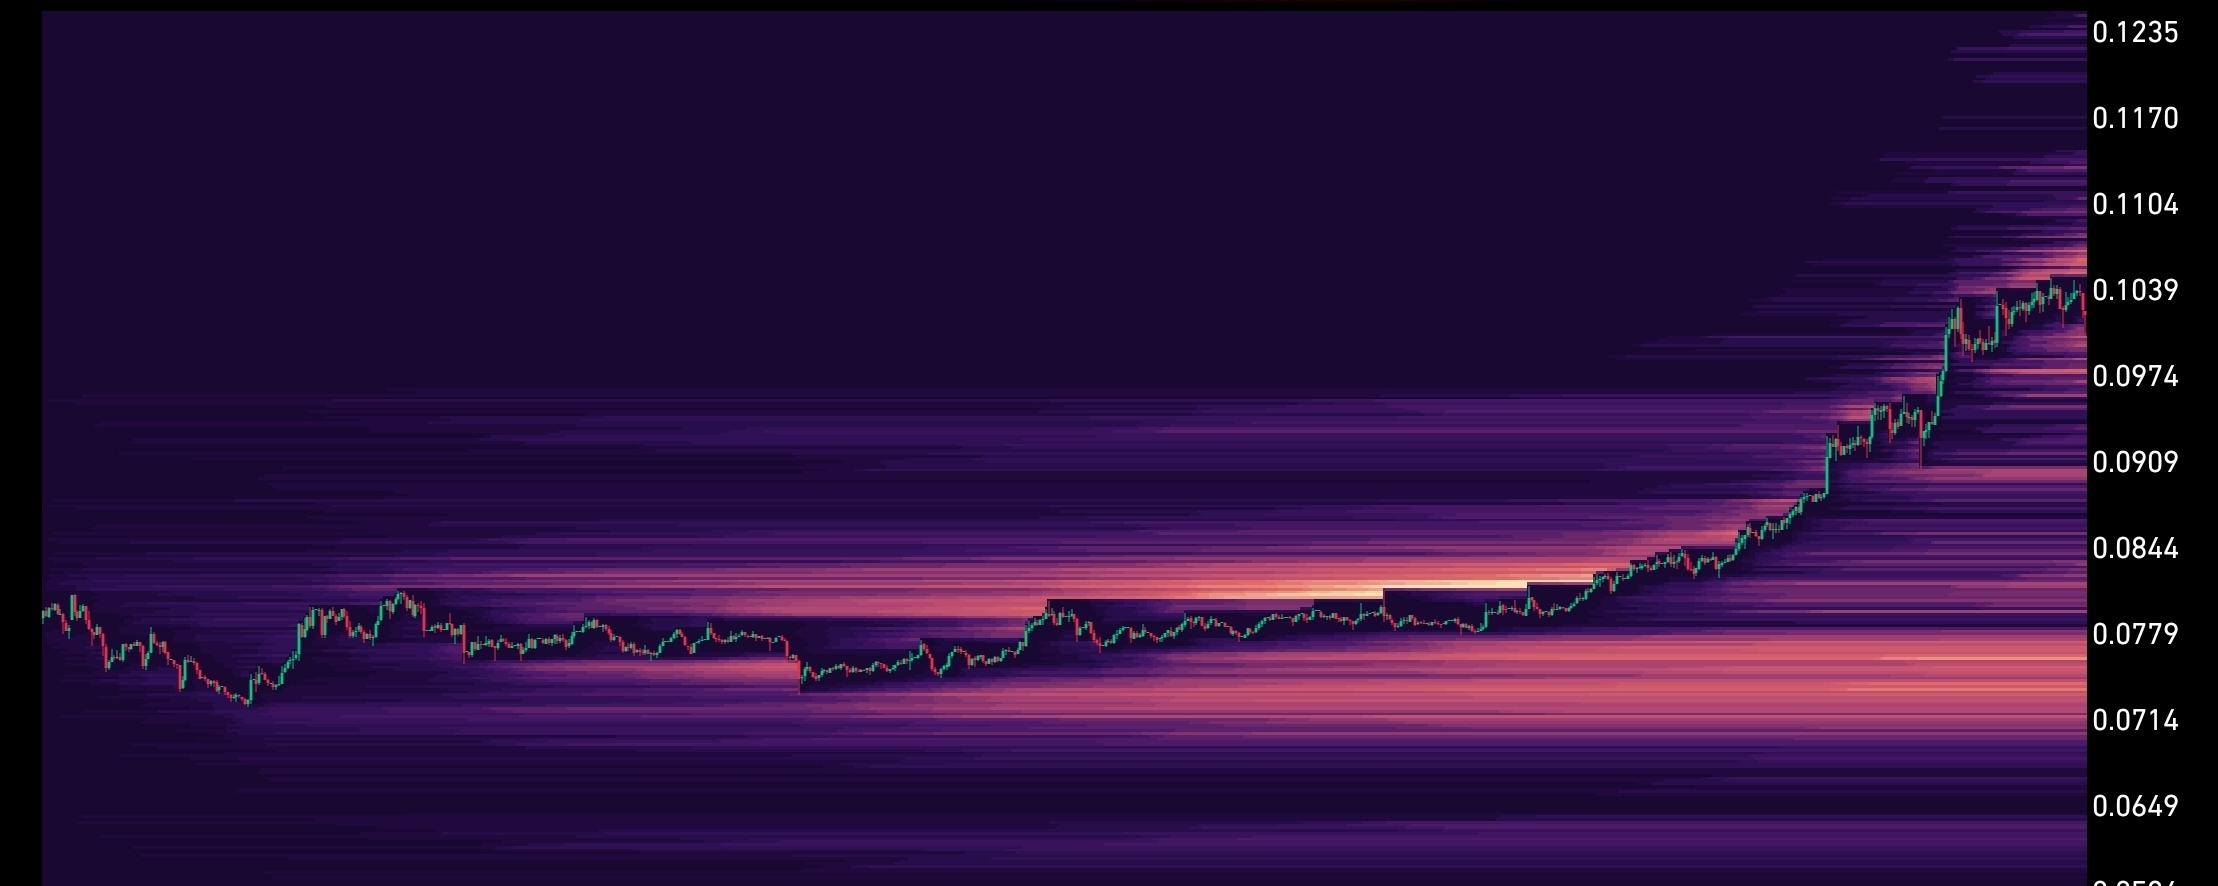
Most traders spend hours studying indicators like RSI, MACD, or moving averages. While those tools have their place, they often fail to show what actually moves the market in the short term: liquidity.
After trading volatile crypto markets for a while, I realized that price doesn't always move because of news or fundamentals. More often than people think, it moves because large players are hunting liquidity. That's why I rely heavily on liquidation heatmaps when trading whale-manipulated tokens.
What Is a Liquidation Heatmap?
A liquidation heatmap shows where leveraged traders are likely to get liquidated. These areas usually contain a large number of stop losses and liquidation orders. Bright colors on the heatmap represent zones with higher liquidation density.
Think of it like a magnet.
The more liquidity sitting at a price level, the more attractive it becomes for whales and market makers.
Why Whales Target Liquidity
Whales don't need to predict the market—they create the move.
If billions of dollars in leveraged positions are waiting to be liquidated above or below the current price, pushing the market into those levels can trigger a chain reaction.
Here's what usually happens:
Price approaches a high-liquidity zone.
Liquidations begin.
Forced buying or selling accelerates the move.
Whales take profits while retail traders panic.
This is why markets often make sudden spikes that seem to have "no reason."
How I Use the Heatmap
I don't blindly buy every token with a large liquidation cluster. Instead, I look for a combination of factors.
First, I identify tokens that whales are actively trading. These are usually low- to mid-cap coins with high leverage and strong volatility.
Next, I look for:
Large liquidation clusters above or below price.
Increasing trading volume.
Strong momentum toward the liquidity.
Clean risk-to-reward opportunities.
If the heatmap shows significantly more liquidity above the current price, I look for long setups.
If the biggest liquidity sits below price, I become cautious or look for short opportunities.
Why This Strategy Works
Markets need liquidity.
Large traders cannot enter or exit massive positions without enough orders on the other side.
Retail traders unknowingly provide that liquidity by placing stop losses and using excessive leverage.
Whales understand this, and that's why price frequently moves toward the biggest liquidity pools before choosing its real direction.
Risk Management Still Comes First
A heatmap is not a crystal ball.
Sometimes liquidity disappears before price reaches it. Sometimes new liquidity forms elsewhere. That's why I never trade based on the heatmap alone.
Every trade should include:
A predefined stop loss.
Proper position sizing.
Confirmation from price action and volume.
A clear invalidation level.
The goal isn't to predict every move—it's to improve the probability of making good trades.
Final Thoughts
Liquidation heatmaps have completely changed the way I view the market.
Instead of asking, "Where will price go?", I ask, "Where is the liquidity that whales are most likely to target?"
That small shift in perspective can make a huge difference.
No strategy wins every trade, but understanding liquidity gives you an edge that many retail traders overlook. In a market driven by leverage, following the money often works better than following traditional indicators.
Trade what the whales are chasing—not what

the crowd is chasing. $BANK