#Contentos #COS #TradeyAI #AIAgent #AI #Write2Earn
Ethereum isn’t just a Layer-1 — it’s the beating heart of decentralized finance, and right now the smartest capital is migrating on-chain while MEV activity churns quietly in the background — potentially setting up a structural breakout.
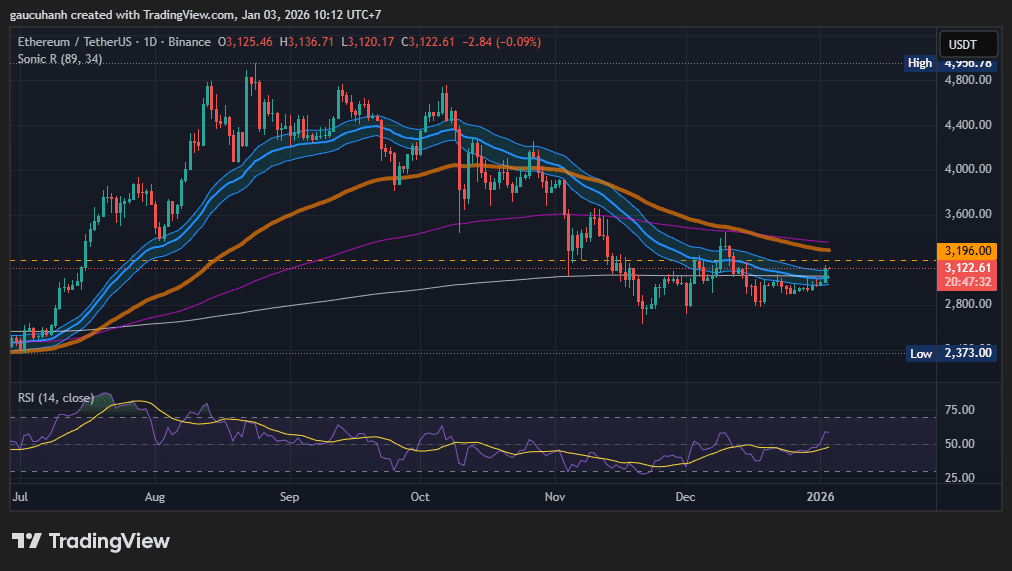
ETH price recently consolidates near key support zones, but on-chain metrics like whale accumulation, MEV flows, staking rates, and exchange outflows tell a deeper story of structural demand. Let’s unpack it.

1. Real On-Chain Signals: Activity, TVL & Staking
Ethereum’s network usage remains intense and genuine:
Daily transaction volume averages nearly 1.6–1.8M transactions, reflecting broad ecosystem engagement across DeFi, NFTs, and smart contracts.
Ethereum DeFi + L2 TVL stands among the highest in crypto (tens of billions across protocols).
Staked ETH reached ~35M+ ETH (≈30% of total supply), significantly reducing liquid supply and nudging long-term demand.
Insight: Rising network use plus rising stake percentages compress liquid supply — a classic supply/demand inflection pattern.
2. Whale Activity: Demand from the Deep Pockets
Large holders are accumulating ETH even during sideways price action — a strong structural signal.
Concrete on-chain whale data (2025):
Over 934,240 ETH added to whale wallets in 3 weeks, signaling institutional confidence.
Whale & shark wallets (1,000–100,000 ETH range) added/net gained ~871K ETH in a single day, the highest daily net inflow seen in 2025.
Longer-term accumulation since April shows whales added millions of ETH, tightening available circulating supply.
Insight: Increasing whale accumulation during market dips often precedes strong market rebounds as supply pressure builds while sell pressure weakens.
3. MEV (Maximal Extractable Value): Invisible Activity With Real Impact
MEV represents additional profit extracted from transaction ordering — a non-price metric that shows capital coordination efficiency among sophisticated on-chain actors.
On-chain insights into MEV activity in 2025:
Research estimates $233.8M extracted through CEX-DEX arbitrage MEV activities (arbitrage across central & decentralized venues) between 2023–2025, illustrating meaningful institutional on-chain revenue flows.

Daily count and weekly volume of detected CEX-DEX trades between August 2023 and March 2025 MEV dynamics are becoming more centralized around major block builders and searcher strategies (e.g., arbitrage + front-run opportunities), indicating evolving infrastructure and capital sophistication.
Some MEV strategies like sandwich profits have softened, showing changing dynamics in how value is extracted and who captures it.
Insight: MEV activity — far from being purely predatory — highlights deep liquidity coordination and institutional participation that often correlates with price action acceleration when fundamental catalysts align.
4. Exchange Flow & Liquidity Dynamics
Exchange reserves are a strong price indicator:
ETH held on exchanges is near multi-year lows, reducing readily available sell-side supply.
Recent whale transfers out of exchanges into staking or self custody suggest accumulation over speculation.
Insight: Less ETH on exchanges often means higher price support and less friction for rallies, especially when network fundamentals align upward.
📌 Conclusion: Multi-Layered Bullish Narrative
Ethereum’s price may appear muted, but multiple on-chain structural factors paint a bullish undertone:
✔ Smart money (whales) accumulating even during volatility
✔ TVL & network usage stable and growing
✔ Staking reducing liquid supply
✔ Institutional flows & MEV infrastructures active in background
✔ Exchange supply shrinking
Collectively, this suggests supply compression with deep demand — a common prelude to breakout phases.
🤝 Engagement Prompt — Binance Square Ready 👇
💬 Which on-chain metric do you think will likely lead ETH’s next breakout — whale accumulation, staking growth, or MEV flows?
📈 Drop your price target for ETH in the next 90 days
🔁 Repost if you found this on-chain dive useful!

