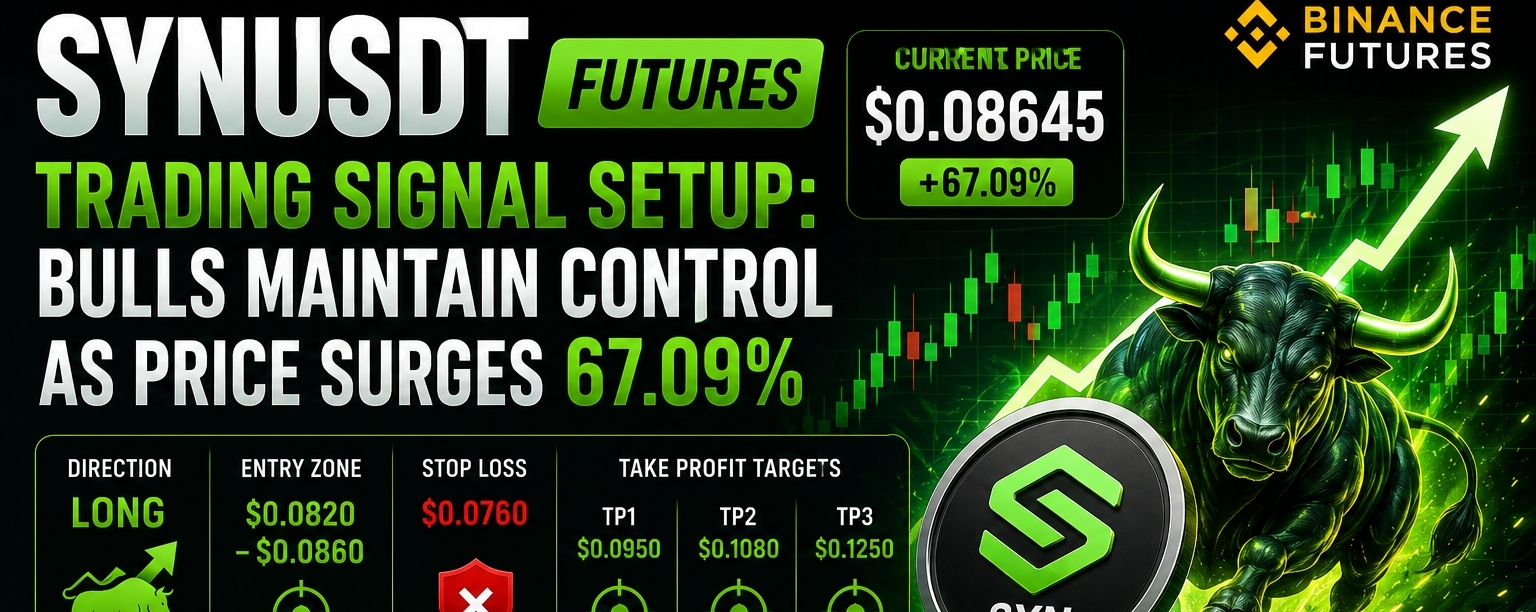
$SYN has emerged as one of the strongest-performing futures contracts in today's market, rallying an impressive 67.09% to trade around $0.08645. The sharp price increase reflects growing trader interest, expanding volume, and strong bullish sentiment across the asset.
Following a decisive breakout above previous consolidation levels, SYNUSDT has entered a momentum-driven phase that is attracting both short-term traders and swing traders. While volatility remains elevated after such a significant move, the broader trend remains bullish as long as key support levels continue to hold.
For futures traders, the current environment presents opportunities to participate in trend continuation while maintaining disciplined risk management.
## Trade Setup
### Direction: LONG 📈
### Entry Zone
$0.0820 – $0.0860
### Stop Loss
$0.0760
### Take Profit Targets
🎯 TP1: $0.0950
🎯 TP2: $0.1080
🎯 TP3: $0.1250
## Risk-to-Reward Ratio
Using an average entry near $0.0840:
Target | Potential Gain | Risk-to-Reward
TP1 | +$0.0110 | 1:1.4
TP2 | +$0.0240 | 1:3.0
TP3 | +$0.0410 | 1:5.1
The setup becomes increasingly attractive as price approaches TP2 and TP3, offering strong reward potential relative to the defined risk.
## Technical Analysis
### 1. Breakout Confirmation
SYNUSDT recently broke above a major resistance zone, signaling the transition from accumulation into expansion. Successful breakouts often attract additional momentum traders.
### 2. Bullish Market Structure
The formation of higher highs and higher lows indicates that buyers remain firmly in control of the trend.
### 3. Rising Volume
One of the strongest confirmations behind the rally is increasing trading volume. Breakouts supported by volume expansion typically have a higher probability of continuation.
### 4. Moving Average Support
Price is trading above key short-term moving averages such as the 20 EMA and 50 EMA, reinforcing the bullish trend.
### 5. RSI Momentum
The Relative Strength Index (RSI) is likely elevated following the recent rally. While this may indicate overbought conditions, strong momentum trends often remain overbought before experiencing meaningful corrections.
### 6. MACD Confirmation
A bullish MACD crossover combined with a positive histogram supports continued upside momentum and strengthens the long setup.
## Key Support Levels
These levels may attract buyers during pullbacks:
### Primary Support
$0.0820
### Secondary Support
$0.0790
### Major Support
$0.0760
Holding these zones would help preserve the current bullish structure.
## Key Resistance Levels
These levels may act as future profit-taking zones:
### Immediate Resistance
$0.0950
### Major Resistance
$0.1080
### Breakout Resistance
$0.1250
A decisive break above these levels could trigger another wave of buying pressure.
## Beginner's Guide
### How to Execute This Trade
If you're new to futures trading:
1. Wait for SYNUSDT to trade within the proposed entry zone.
2. Open a LONG position.
3. Place your stop loss immediately after entry.
4. Set your take-profit targets before entering the trade.
5. Avoid chasing large green candles after rapid price spikes.
Patience often leads to better entries and lower risk.
### Position Sizing Tips
For beginners:
✅ Risk only 1%–2% of your trading account on a single trade.
✅ Use low to moderate leverage.
✅ Never risk money you cannot afford to lose.
✅ Focus on preserving capital rather than maximizing profits.
Example:
$500 account → Risk $5–$10
$1,000 account → Risk $10–$20
$5,000 account → Risk $50–$100
## Trade Management
### Move Stop Loss to Breakeven
Once price reaches TP1 ($0.0950):
Consider taking 30%–50% profit.
Move your stop loss to your entry price.
This protects capital while maintaining exposure to further upside.
### Secure Additional Profits
When price reaches TP2 ($0.1080):
Lock in additional gains.
Trail your stop loss below recent higher lows.
Allow the remaining position to continue toward TP3.
### Let Winners Run
If bullish momentum remains strong:
Continue trailing the stop loss.
Hold the remaining portion of the position for TP3.
This strategy helps maximize profits while protecting accumulated gains.
## Why Traders Are Watching SYNUSDT
Several factors have placed SYNUSDT on traders' watchlists:
### Strong Daily Performance
A 67.09% gain signals strong relative strength and increasing market attention.
### Growing Volume
Higher volume indicates genuine participation and improved liquidity.
### Breakout Momentum
The recent breakout has created a favorable environment for trend-following traders.
### Potential Continuation Setup
As long as support levels hold, SYNUSDT may continue attracting momentum buyers.
## Final Thoughts
SYNUSDT is currently displaying one of the strongest bullish structures in the market, supported by a 67.09% rally, increasing volume, and a confirmed breakout pattern. The combination of trend strength and improving market participation creates a compelling long-biased futures setup.
However, traders should remain disciplined and avoid emotional decision-making. The best trading results often come from following a clear plan, respecting stop-loss levels, and managing risk effectively.
Remember: successful futures trading is not about catching every move—it's about consistently executing high-probability setups while protecting capital.
#SYNUSDT #CryptoSignals #FuturesTrading #BinanceSquare #TechnicalAnalysis #CryptoTrading #Altcoins #RiskManagement #TradingEducation #BullishBreakout #MomentumTrading #CryptoMarket