🚨 Or are we facing the greatest accumulation_opportunity of this economic cycle?

Markets are bleeding, fear grips everyone, and screens are awash in red...
But the big whales and market_makers are viewing the data from a completely different perspective.
Let's delve into what's happening behind the scenes and analyze the charts and on-chain data in a simplified and professional manner that shows you where the next Bitcoin train is headed. 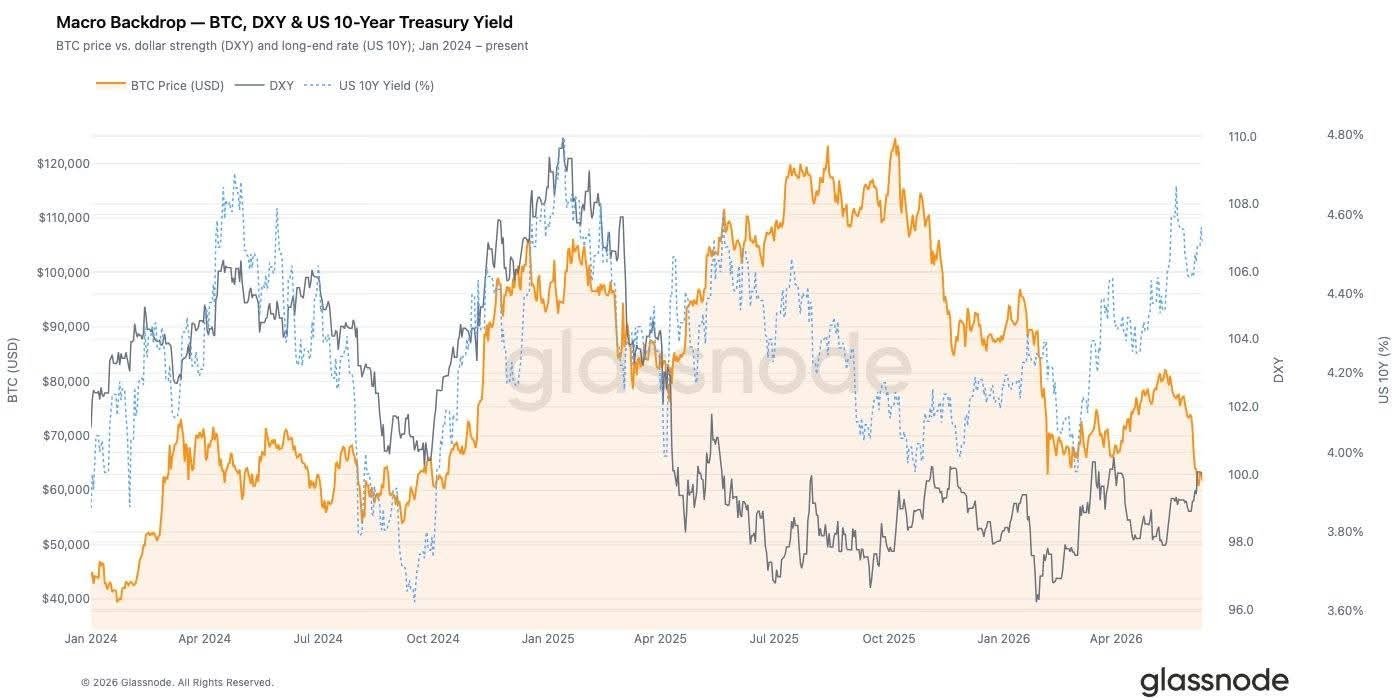
1️⃣ Macroeconomics Takes Control:
The Dollar Flexes Its Muscles 💵 We can't understand Bitcoin's movement without looking at the maestro (US monetary policy):
Dollar_Index (DXY):
Closed at 100.01 (up 2.1% in a month).
A strong dollar means tighter global liquidity.
US_Treasury_Yields (10-Year Yield):
Steady at 4.53%.
🟢 The inverse relationship between the dollar and Bitcoin has resurfaced strongly.
For Bitcoin to see a genuine and sustained recovery, we need the dollar index to fall below 99 or bond yields to drop to around 4.2%.
Until that happens, the markets will remain under pressure.
2️⃣ On-chain data:
New buyers are being squeezed.
🩸 On-chain data reveals the extent of the current market woes, with classic indicators nearing bottom:
AVI_z-score: dropped to -1.06.
This means Bitcoin is currently trading at an extreme discount compared to its historical average.
Bitcoin is structurally very cheap.
Short_Term_Investors (STH) are underwater:
Over 95% of new buyers are currently experiencing unrealized losses (their purchase prices were between 78k and 82k).
Their winning supply ratio has plummeted to just 3.3% (compared to a historical average of 55%).
SOPR Capability Indicator:
Registered at -1.86 (very close to the violent capitulation level of -2).
Losses are being triggered rapidly, meaning we are approaching the final settlement before major bounces. 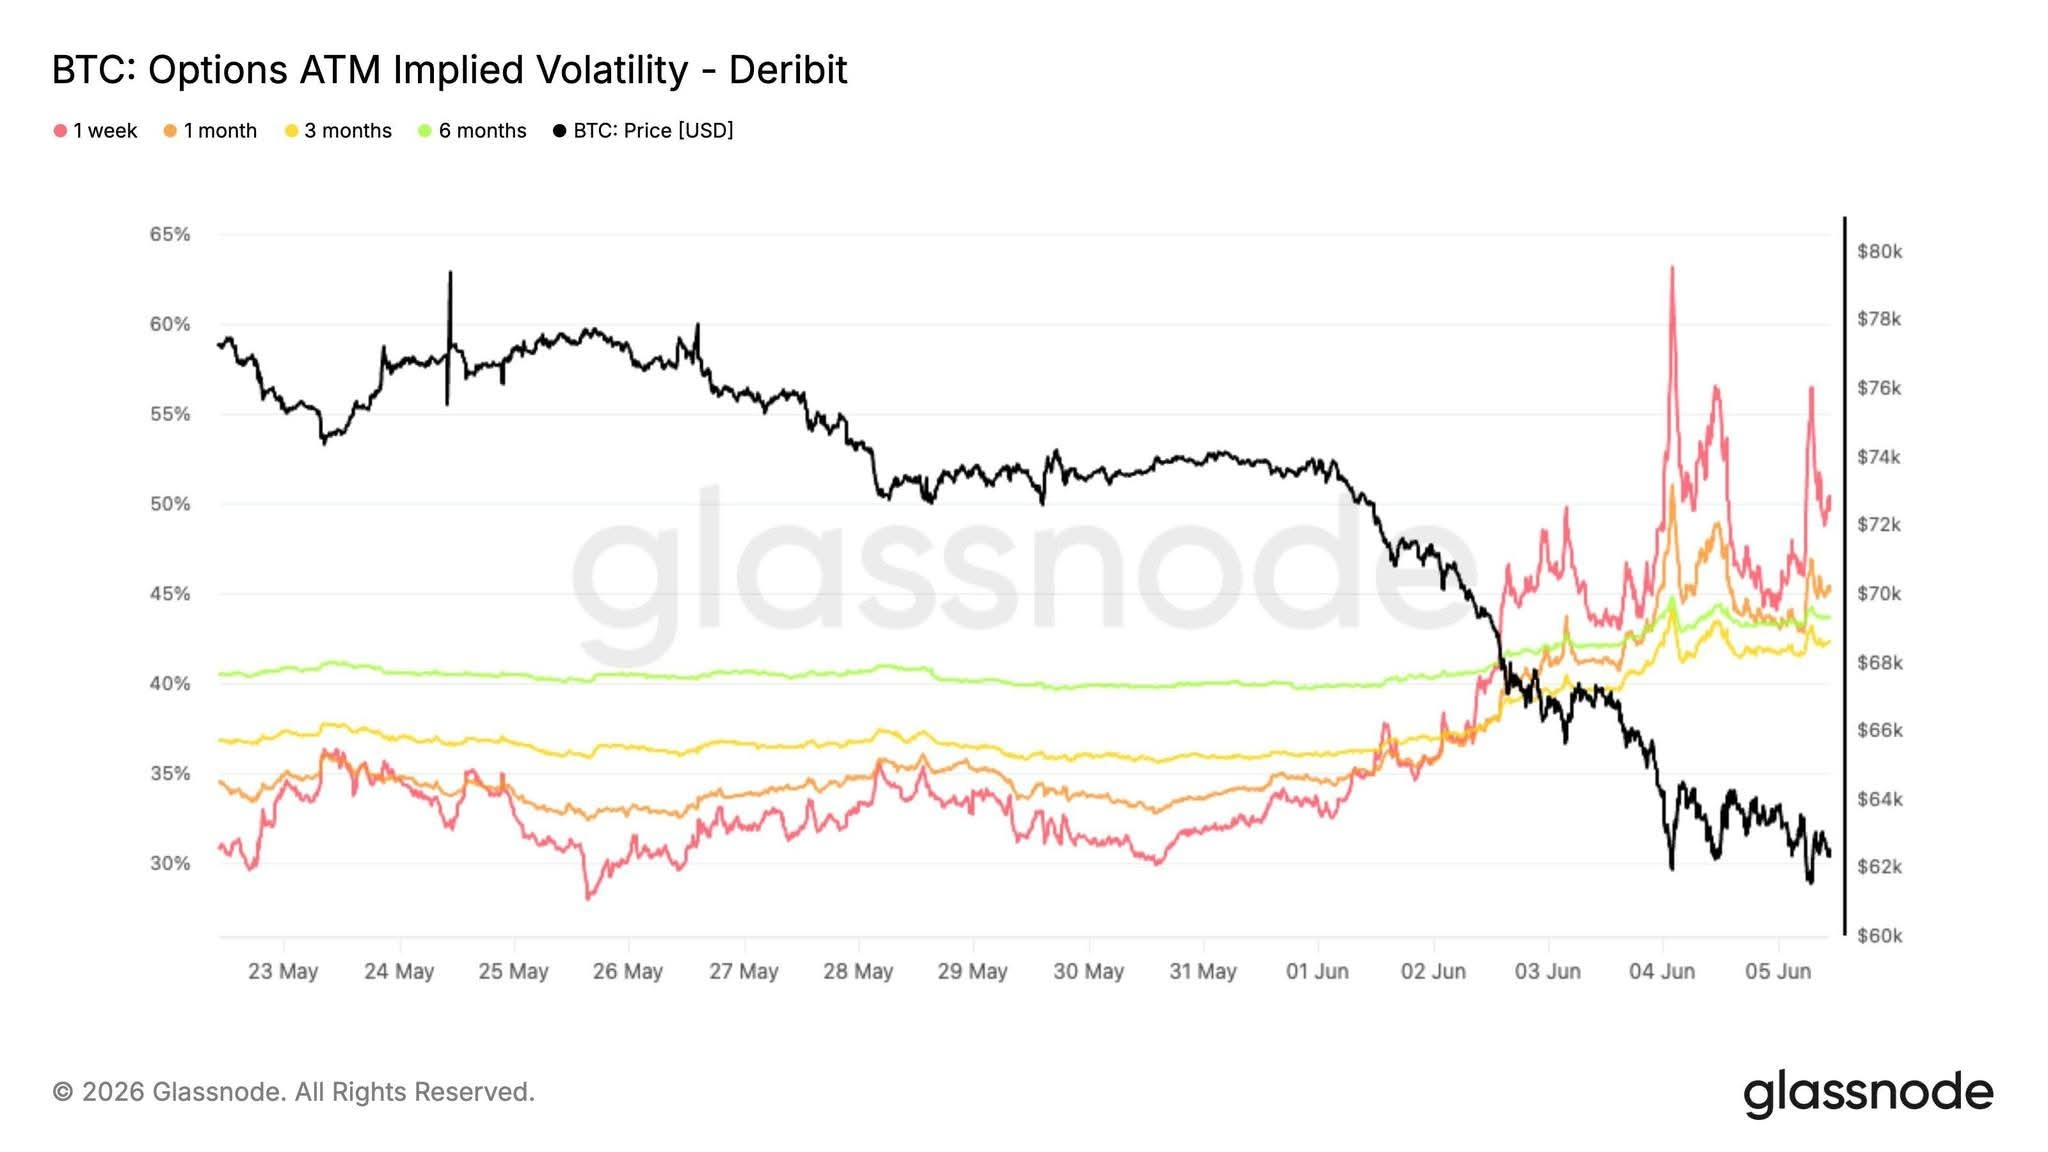
3️⃣ Institutional Silence:
Where did the smart money go?
🤫 Coinbase Premium:
Turned into discount territory during the $60,000 drop.
This means that major US institutions are currently on hold from aggressive spot buying and prefer to observe.
Corporate Treasuries:
Daily buy flows have plummeted from $500 million in May to near zero now.
Everyone is adopting a "wait and see" approach.
4️⃣ Derivatives and Options Market:
Leverage Flush 🧹 Leverage Flush:
The recent drop below $64,000 has cleared out high-risk long positions.
The market is now structurally cleaner and less debt-laden.
OptionsMarket:
Professional traders are paying extra to protect themselves against a downturn (high Skew and Implied Volatility).
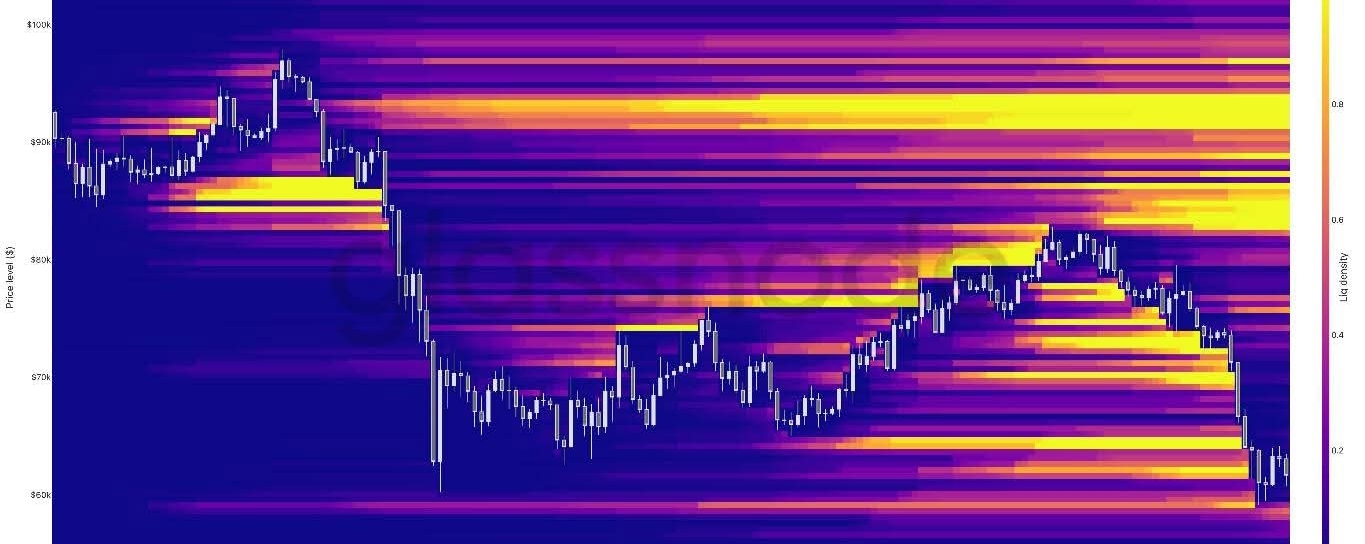
There's a massive defensive firewall (negative gamma) centered around the $65,000 level.
BottomLine and NextDestination:
We're currently in a late-stage correction.
Leverage has cleared, and prices are at very attractive historical discount levels, but the missing catalyst so far is a return of strong spot demand. 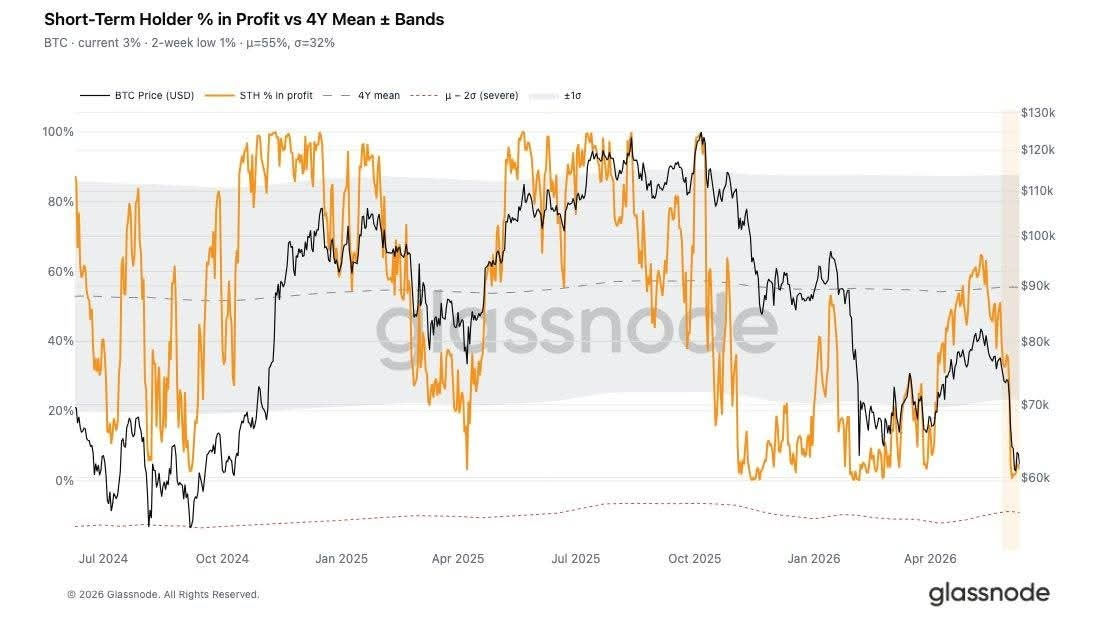
My advice:
Watch the $60,000 level as a rocky support level and wait for a signal of renewed institutional liquidity.
Now, share your thoughts in the comments:
Do you think Bitcoin will hold above $60,000 and begin its upward trajectory, or will we see a dip to lower levels before it takes off?
🔥 Click the follow button and interact with the post to receive exclusive updates and analyses first!
