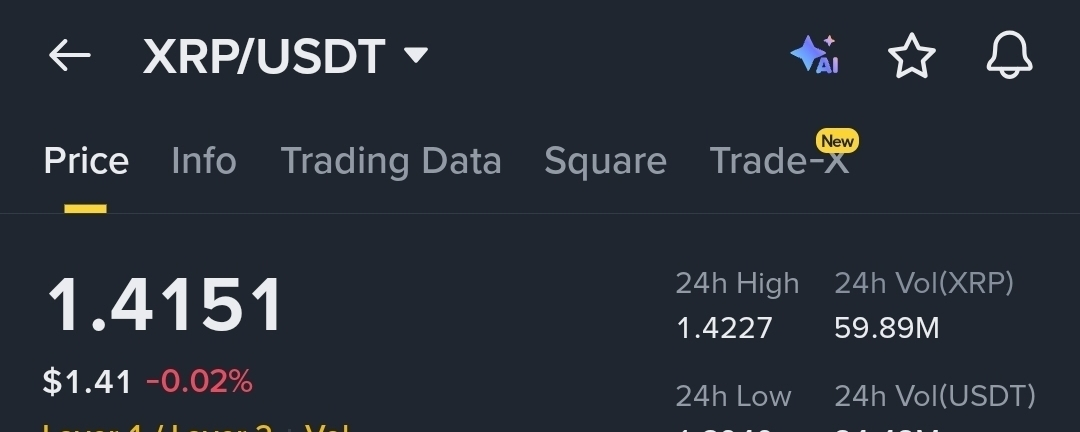
The XRP/USDT pair is currently trading around $1.415 on the 15-minute timeframe, and the chart is showing a very interesting short-term structure that traders should pay close attention to.
At first glance, the market looks slightly bearish because price has pulled back from the recent local high near $1.4227. However, when we look deeper into the technical indicators, the picture becomes much more interesting.
Current Market Structure
XRP recently attempted to break higher and touched the $1.422 area before facing rejection. After that move, sellers entered the market and pushed price back toward the middle Bollinger Band zone.
Right now, price is trading:
Below the upper Bollinger Band
Near the middle Bollinger Band
Slightly above the lower support region
This tells us that momentum has cooled down after the recent push upward.
The latest candles also show consecutive red candles with weakening buying pressure. Short-term traders are clearly taking profits while the market waits for the next direction.
Moving Average Analysis
The chart shows:
MA(7): 1.4176
MA(25): 1.4156
MA(99): 1.4132
This setup is extremely important.
The short-term MA(7) is still above the long-term MA(99), which means the broader short-term trend remains bullish despite the recent pullback.
At the same time, price is now testing the MA(25) support zone. This area often acts as a decision point between continuation and deeper correction.
If buyers defend this level successfully, XRP could attempt another push toward:
$1.4185
$1.4200
$1.4227
But if sellers break below the MA(25) and MA(99), we may see a deeper retracement toward:
$1.4140
$1.4106
$1.4060
Bollinger Band Signal
The Bollinger Bands are beginning to tighten slightly after recent volatility.
Current Bollinger levels:
Upper Band: 1.4200
Middle Band: 1.4171
Lower Band: 1.4143
Price moving close to the lower Bollinger Band usually signals either:
Oversold short-term conditions
Beginning of stronger bearish momentum
This means the next few candles are extremely important.
A bounce from the lower band could trigger quick recovery momentum. A breakdown below the lower band could increase selling pressure rapidly.
KDJ Indicator Analysis
The KDJ indicator currently shows:
K: 25.47
D: 38.11
J: 0.17
This is one of the most important signals on the chart.
The J line has dropped aggressively near the oversold region, showing that bearish momentum may already be overextended in the short term.
Historically, when the J value falls this low, XRP often experiences:
Short-term relief bounces
Volatility spikes
Sudden recovery candles
That does not guarantee immediate upside, but it does indicate that sellers may be losing momentum.
Volume Observation
24-hour volume remains strong:
XRP Volume: 59.89M
USDT Volume: 84.48M
Strong volume during consolidation is always important because it means traders are still highly active.
Low-volume pullbacks inside high-volume trends often become continuation setups.
This is why many traders are now watching for confirmation before entering their next position.
Bullish Scenario
For bulls to regain control, XRP needs:
Strong support above $1.4140
Reclaim of the middle Bollinger Band
Break above $1.4185
Momentum push toward $1.4227 resistance
If buyers successfully break the recent high, market sentiment could become extremely bullish again.
Bearish Scenario
For bears, the key objective is simple:
Break below $1.4140
Push price under MA(99)
Increase selling volume
If that happens, XRP may enter a stronger short-term correction phase.
Final Thoughts
Right now, XRP is sitting at a critical decision zone.
The market is showing short-term weakness, but several technical indicators suggest the downside momentum may already be slowing.
Traders should watch the next few candles carefully because this area could determine whether XRP continues its bullish structure or enters a larger pullback.
Patience and confirmation are extremely important in this kind of market.
The smartest traders usually wait for the market to reveal direction before making aggressive entries.
#XRP #XRPUSDT #Binance #CryptoTrading #TechnicalAnalysis #Altcoins #Bullish #TradingView #CryptoNews #BinanceSquare